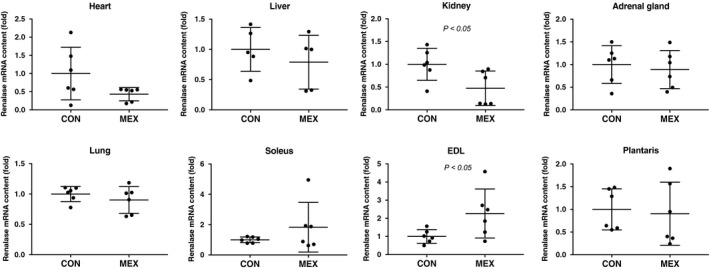
Fig. 3.

Renalase mRNA contents in each tissue after MEX. The mRNA content of renalase in each tissue was compared between the CON and the MEX groups using the ΔΔC t method. Data are shown as mean ± SD. n = 5 or 6 per group. Data were analyzed using a Student’s t‐test. Statistical significance was set at P < 0.05 between the CON versus MEX groups.
