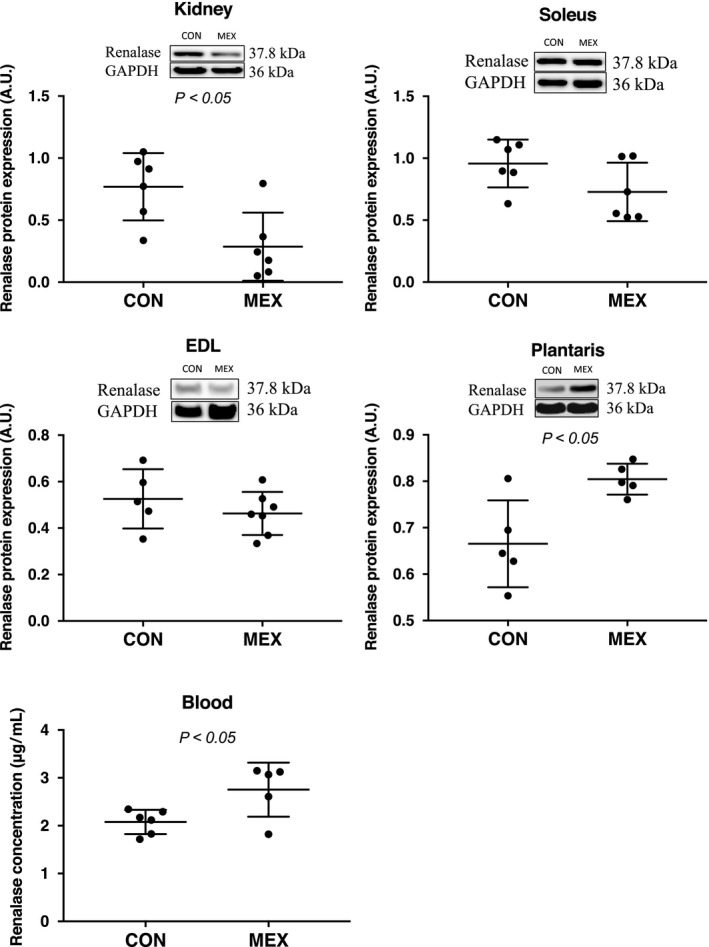
Fig. 4.

Tissue expression levels and concentration of renalase in the blood after MEX. The expression of renalase, at the protein level, in the skeletal muscles was compared between the CON and MEX groups using western blotting. The concentration of renalase in the blood was measured by ELISA. Data are shown as mean ± SD. n = 5 or 6 per group. Data were analyzed using a Student’s t‐test. Statistical significance was set at P < 0.05 between the CON versus MEX groups.
