
Figure 2.
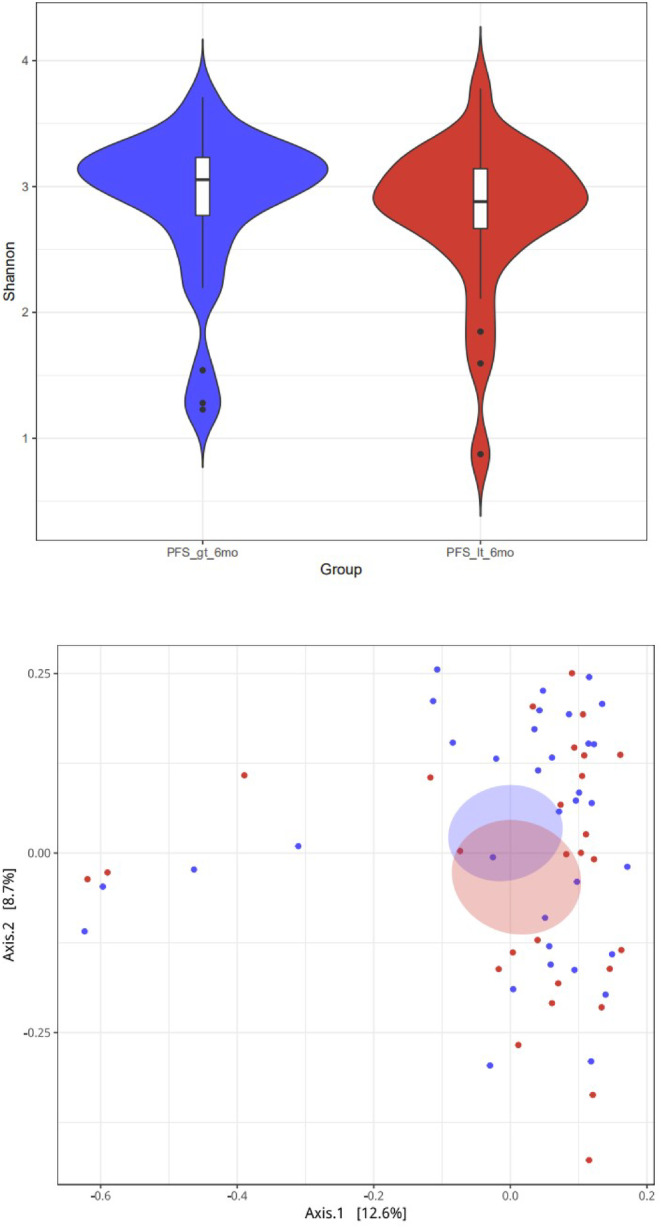
(a) Comparison of α diversity of different groups at the flora level. Group ( ) PFS_gt_6mo, (
 ) PFS_it_6mo (b) PCoA results based on the sample distance calculated by the flora (Note: PFS_gt_6 mo = PFS ≥ six‐months, PFS_it_6mo = PFS < six‐months). Group (
 ) PFS_gt_6mo, (
 ) PFS_it_6mo