
Figure 5.
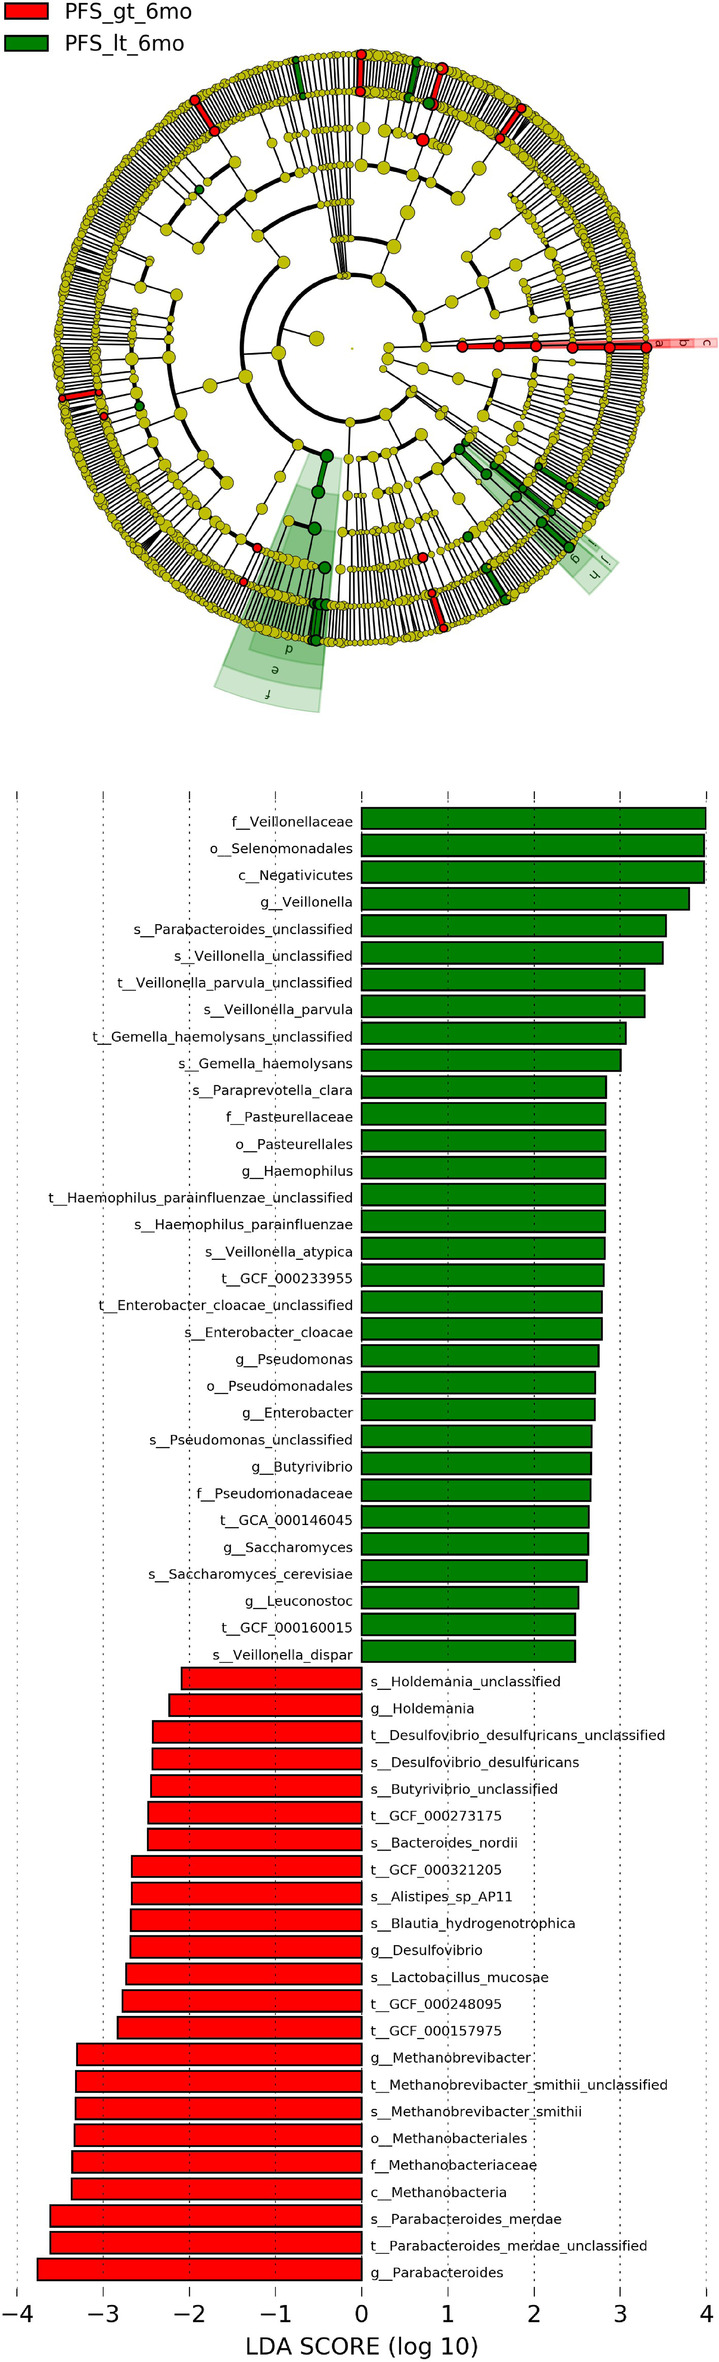
Linear discriminant analysis (LDA) scores for different groups. The LEfSe classification results and classification chart show the differences in fecal taxa. The size of the dots is proportional to the abundance of the taxon. LDA scores of the different taxa in the stool microbiome of PFS ≥ six months (red) and PFS < six months (blue); the length indicates the size of the effect related to the taxonomy, LDA score > 3 is significant. (Note: PFS_gt_6mo = PFS ≥ six‐months, PFS_it_6mo = PFS < six‐months). ( ) PFS_gt_6mo, (
 ) PFS_it_6mo, (
 ) Methanobacteriaceae, (
 ) Methanobacteriales, (
 ) Methanobrevibacteria, (
 ) Veillonellaceae, (
 ) Selenomonadales, (
 ) Negativicutes, (
 ) Pasteurellaceae, (
 ) Pasteurellales, (
 ) Pseudomonadaceae, (
 ) Pseudomonadales