Fig. 3.

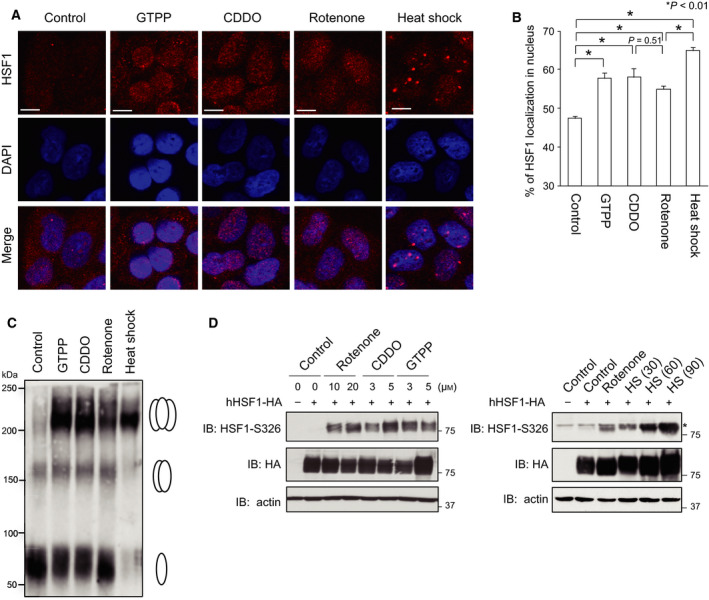
HSF1 is moderately activated in response to impaired mitochondrial proteostasis. (A) Nuclear translocation of HSF1 in response to impaired mitochondrial proteostasis. HeLa cells were treated with 10 μm GTPP, 5 μm CDDO, or 20 μm rotenone for 6 h. Some cells were also treated with heat shock at 42 °C for 30 min. The cells were costained with an antibody for HSF1 and the nuclear marker DAPI, and fluorescence images were merged (Merge). Bars, 20 μm. (B) Quantitative estimation of HSF1 signals in the nucleus. Fluorescence signals in the nucleus and total fluorescence signals from the cell were estimated (n = 20), and percentages of HSF1 localized in nucleus are shown. Mean ± SD is shown. Asterisks indicate P < 0.01 by one‐way ANOVA, compared with the percentage in control cells. (C) Trimer formation of HSF1. MEF cells were treated with 10 μm GTPP, 5 μm CDDO, or 20 μm rotenone for 6 h, or heat shock at 42 °C for 30 min. Whole‐cell extracts were prepared, and aliquots containing 40 μg protein were mixed with a cross‐linking reagent DSG at a final concentration of 5 mm at room temperature for 30 min and were subjected to western blotting using HSF1 antibody. Positions of HSF1 monomer, dimer, and trimer are indicated on the right. (D) Phosphorylation of HSF1‐Ser326. HSF1‐null (HSF1−/−) cells were infected with adenovirus expressing HA‐tagged human HSF1 (1 × 10⁸ pfu·mL−1) for 2 h and maintained with normal medium for 46 h. The cells were treated with GTPP, CDDO, or rotenone at the indicated concentrations for 6 h (left), or treated with 20 μm rotenone for 6 h or heat shock (HS) at 42 °C for 30, 60, or 90 min (right). Cell extracts were prepared and subjected to western blotting using HSF1‐phospho‐S326 (S326P), HA, or β‐actin antibody. An asterisk indicates nonspecific bands.
