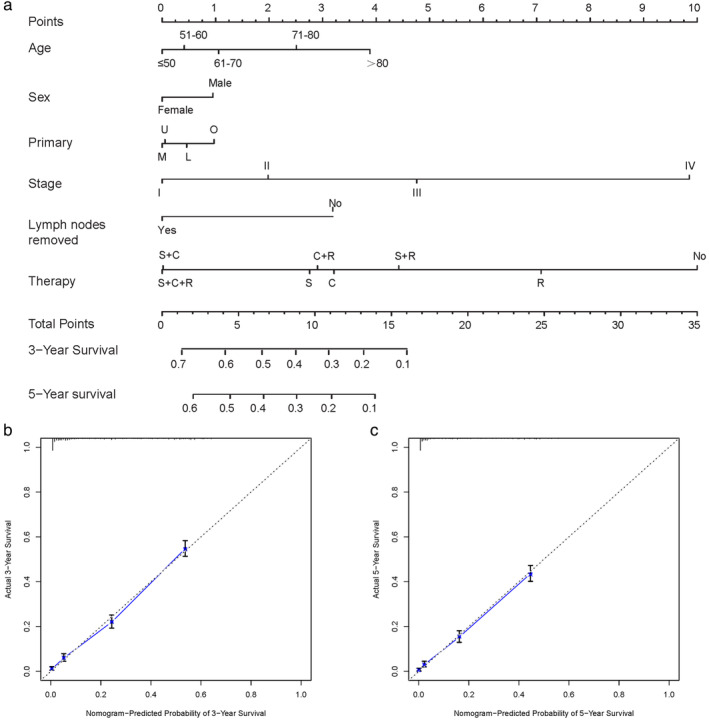
Figure 2.

Nomogram and overall survival nomogram calibration curves. (a) Nomogram for prediction of three‐ and five‐year overall survival of patients with LCC. Calibration plots of the nomogram prediction of (b) Three‐year; and (c) Five‐year overall survival. The blue line represents the equality of the observed and predicted probability. C, chemotherapy; L, lower lobe; M, middle lobe; NT, no therapy; O, others; R, radiotherapy; S, surgery; U, upper lobe.
