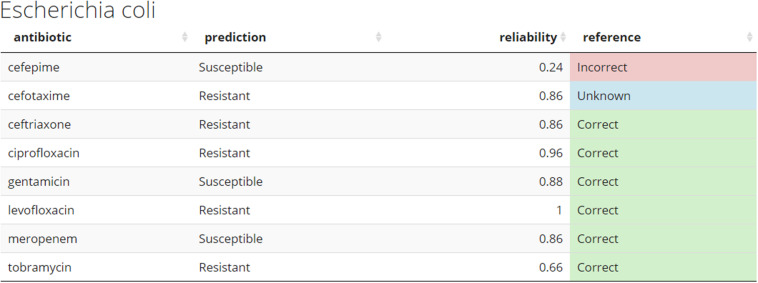
FIGURE 6.
Example of the predicted antibiogram. An illustration of the output from the R shiny app using the sample SAMN07450853 from the Demo set. Other samples from the Demo and In-house datasets can be accessed through the app. The “reference” column compares the predicted resistance to the one confirmed in the clinical laboratory. This would normally not be present at the time the models do their prediction for de novo samples. Color coding used: green – correct, red – incorrect, and blue – unknown.

