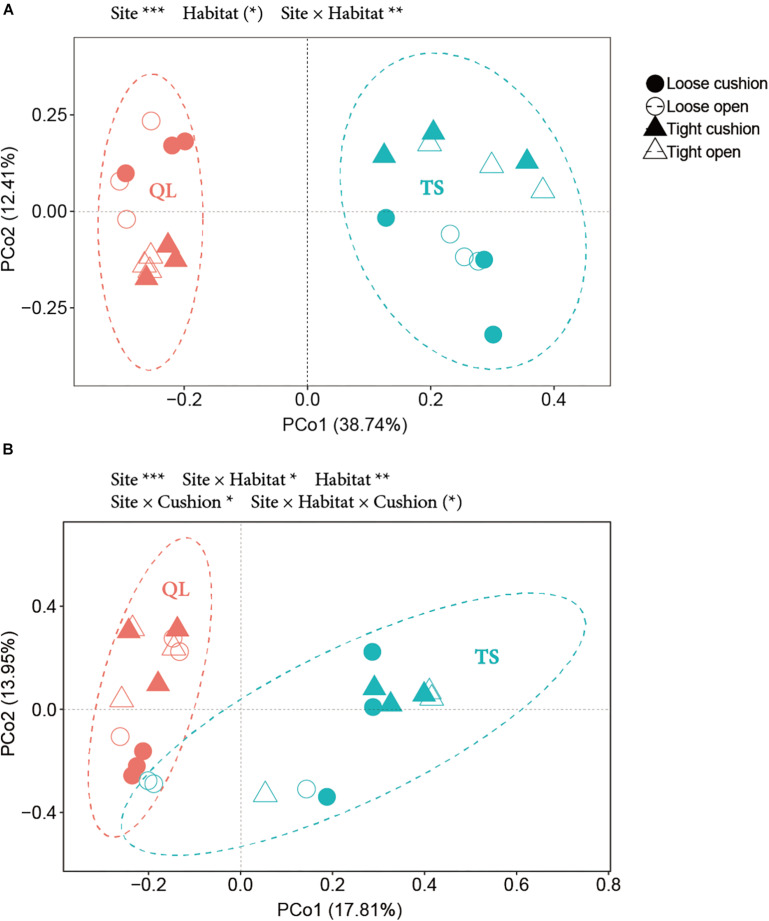
FIGURE 10.
PCoA (Principal coordinate analysis) based on OTUs data from (A) bacteria and (B) fungi. Solid and hollow shapes indicate cushion and non-cushion plots, respectively. Circles and triangles indicate loose and tight phenotypes, respectively. Pink and blue indicate Qilian (QL) and Tianshan (TS) mountains, respectively. Ellipses show the 95% confidence intervals of the samples from each site. Results of treatment effects in the NPMANOVA are given on the top of each panel: * P < 0.05; ** P < 0.01; *** P < 0.001; (*) P < 0.1.

