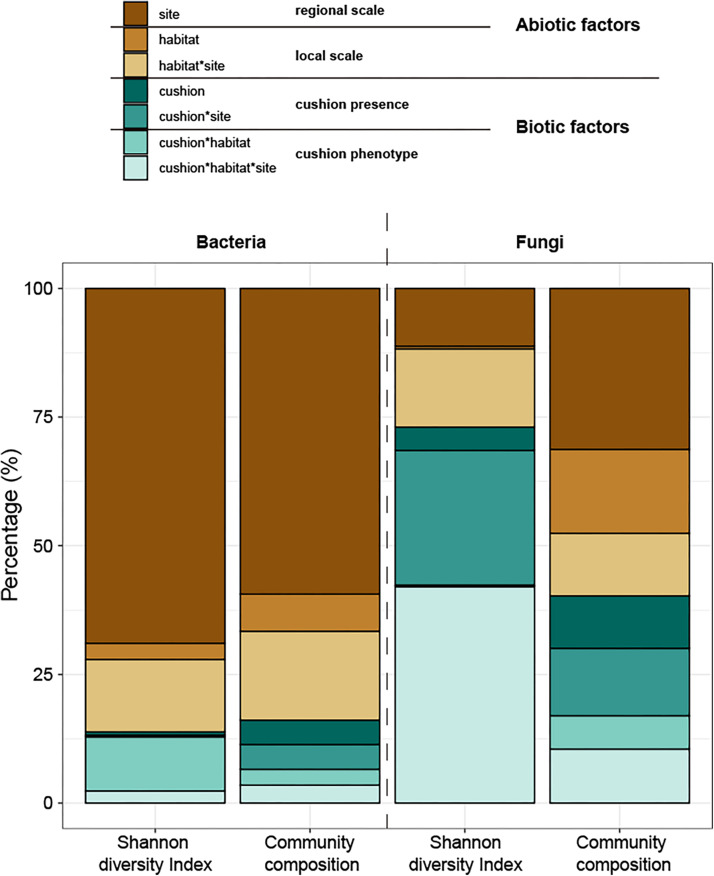
FIGURE 11.
Variance partitioning of the different treatment effects and their interaction on the Shannon diversity indexes and composition of microbial communities. The colors of brown series indicate abiotic effects (regional and local abiotic factors); the colors of the green series indicate biotic effects (cushion presence and cushion phenotypes). Each color indicates the specific factor as shown in the legend on the top of the panel.

