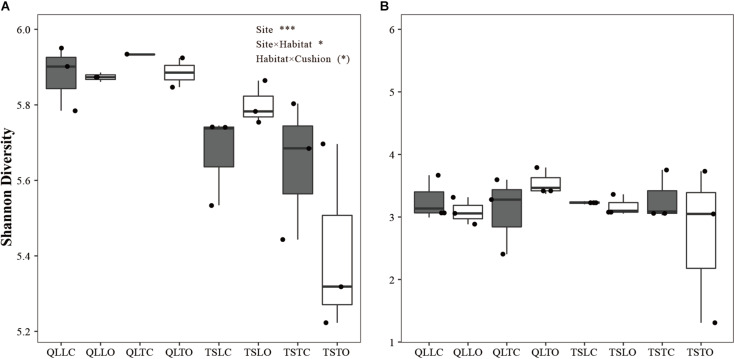
FIGURE 2.
Mean (±SE) Shannon diversity index for (A) bacterial and (B) fungal communities from the soils of the loose and tight phenotypes of Thylacospermum caespitosum (black boxes) and their paired open plots (white boxes) in the two mountain ranges. The first three letters of QLL and QLT indicate loose and tight phenotypes in the Qilian mountains, respectively; TSL and TST indicate loose and tight phenotypes in the Tianshan mountains. Results of the effects of the Site, Habitat, Cushion treatments and their interactions are indicated above panel. (*)P < 0.1; *P < 0.05; ***P < 0.001.

