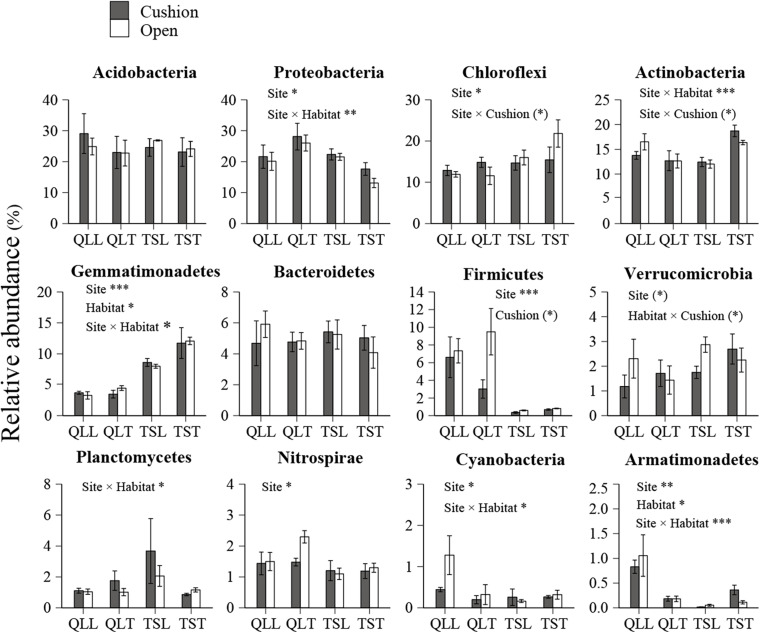
FIGURE 4.
Mean (±SE) relative abundance of main bacterial taxonomic groups at the phylum level from the soils of the loose and tight phenotypes of Thylacospermum caespitosum (black bars) and their paired open plots (white bars) in the two mountain ranges. Legend of bars is the same as in Figure 2. Results of the effects of the Site, Habitat, Cushion treatments and their interactions are indicated above each panel. *P < 0.05; **P < 0.01; ***P < 0.001; (*)P < 0.1.

