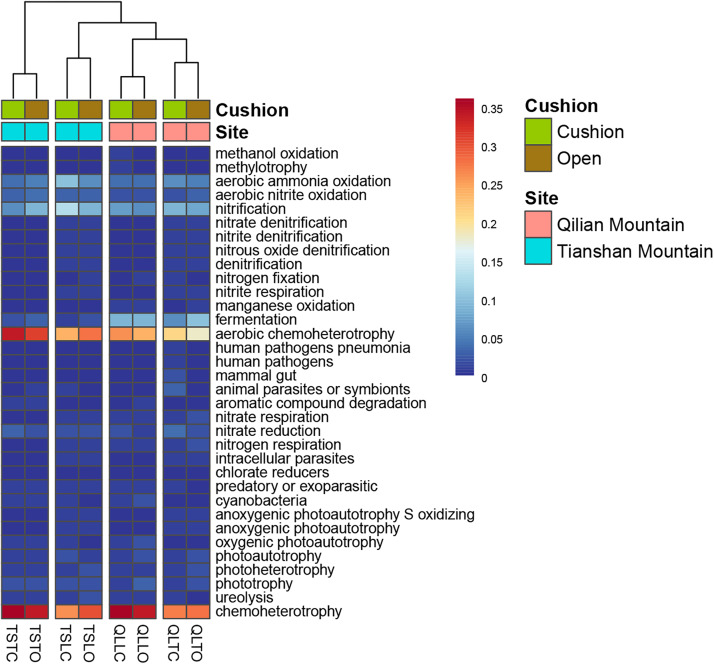
FIGURE 6.
The functional profile of the bacterial community. The samples were clustered by the relative abundance of the assigned functional groups. The third letter of sample names (i.e., L and T) indicate the loose and tight phenotypes, respectively; the samples below cushions of the two phenotypes and in adjacent open areas which were labeled with green and brown colors, respectively.

