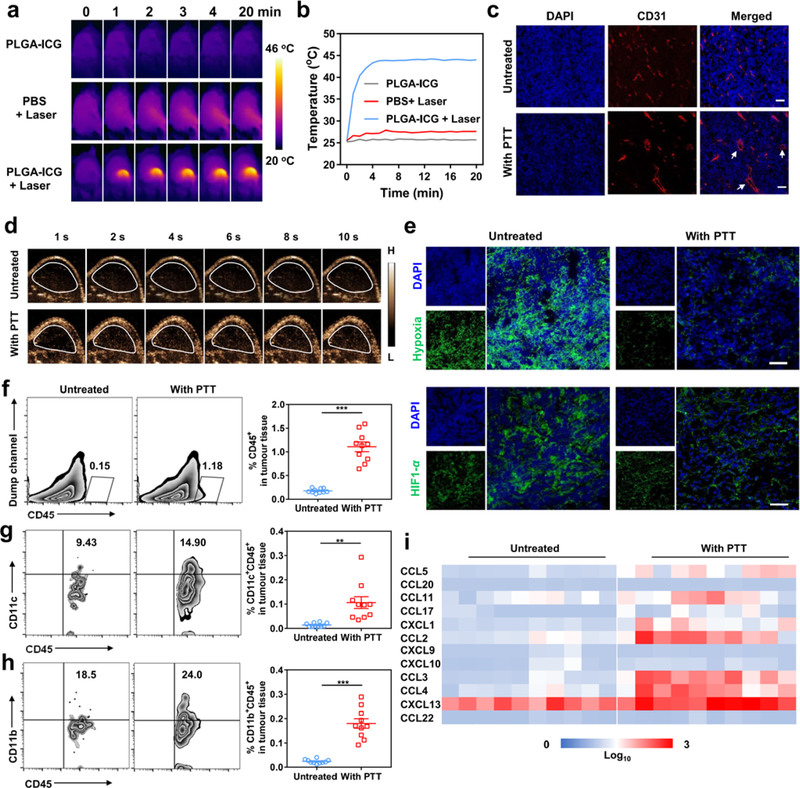
Figure 3. Photothermal therapy of the tumor modifies the tumor microenvironment.
(a) IR thermal images of WM115-tumor-bearing mice injected with PLGA-ICG or PBS with the 808 nm laser irradiation (0.3 W/cm2, 20 min). (b) Changes of the tumor temperature measured by the IR thermal imaging. (c) Immunofluorescence imaging of tumors collected from mice 24 hours after photothermal therapy. Scale bar, 50 μm. (d) Ultrasound imaging illustrating the blood perfusion of the WM115 tumors. Microbubbles injected intravenously were used as the ultrasound contrast agent. (e) Representative hypoxia and HIF1-α immunofluorescence staining of the tumors after photothermal therapy (Scale bar, 50 μm). (f) Representative flow cytometry plots and quantification of murine CD45+ cells infiltrating the tumor after photothermal therapy. Data are presented as mean ± s.e.m. (n=10). (g & h) Representative flow cytometry plot and quantification of murine CD11c+ (g) and CD11b+ (h) cells gating on CD45+ cells. Data are presented as mean ± s.e.m. (n=10). (i) Quantification of chemokines in the tumor (n=10). Statistical significance was calculated via two-tailed Student’s t-test. P value: *P < 0.05; **P< 0.01; ***P < 0.001.

