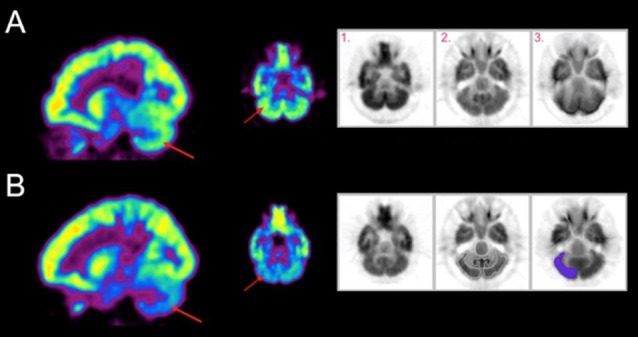
Figure 1.

Metabolic activity maps are shown for (A) an individual with a low Selective Control Assessment of the Lower Extremity (SCALE) score and (B) an individual with a high SCALE score. Red arrows indicate the right cerebellum. The gray scale images (inset) for each row show 1. Participant’s original positron emission tomography (PET) scan, 2. Template PET scan on which standardized regions of interest are defined and 3. Activity resampled on the template. Relative hypoactivity was found in the cerebellum of the individual with a high SCALE score, indicated by the indigo color using a rainbow scale (violet being the lowest and red being the highest).
