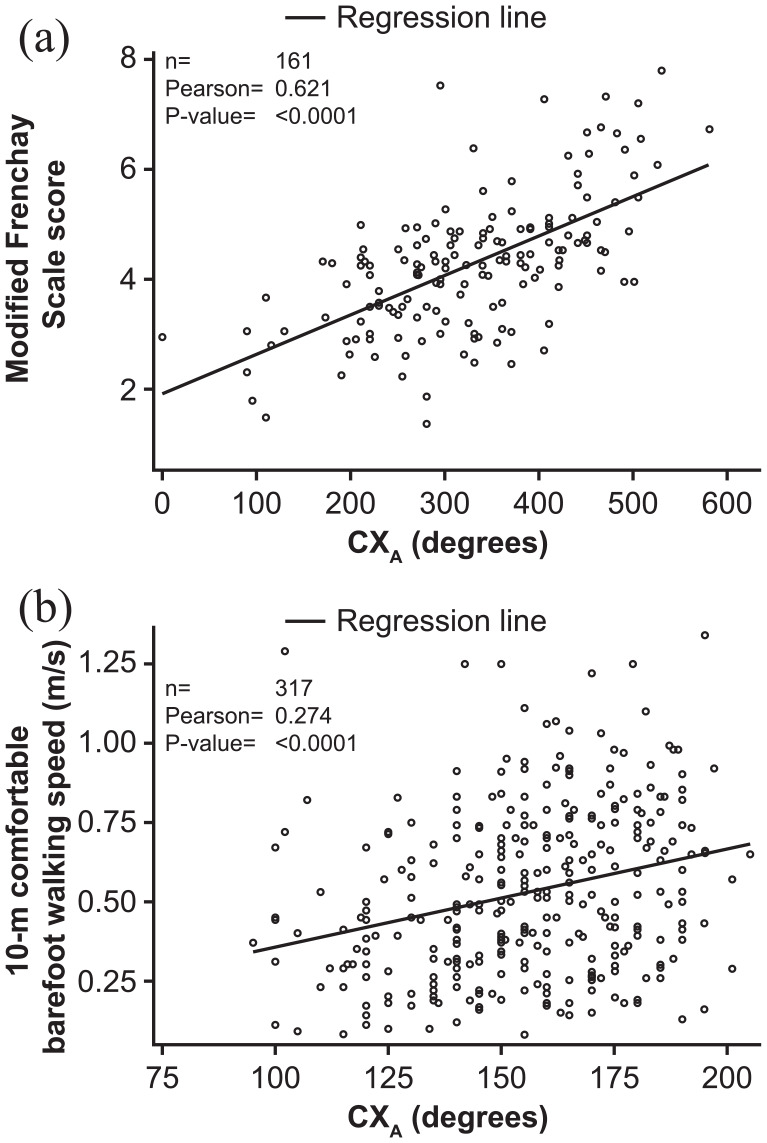
Figure 3.

Scatterplot and correlation analysis for CXA and active function at Week 12 of Cycle 1 in (a) upper limb and (b) lower limb.
CXA: composite active range of motion; MFS: Modified Frenchay Scale; n: number of patients with data available.
Data are presented as absolute values.
