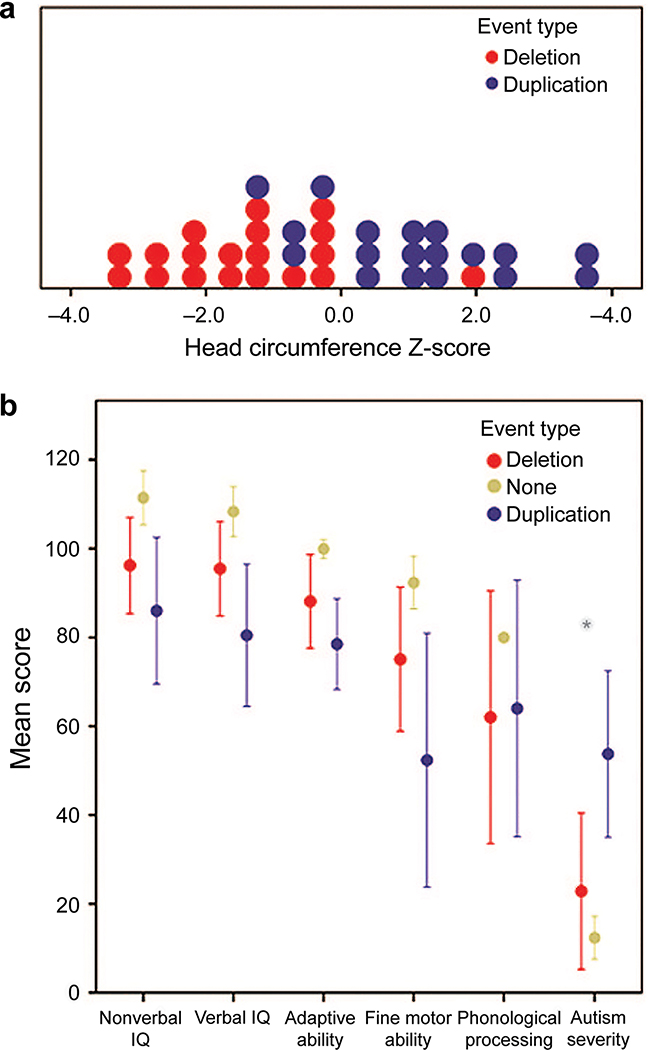
Figure 1: Dimensional Assessment of Participants.
(a) Histogram revealing smaller mean standardized head circumference for deletion carriers (red) relative to duplication carriers (blue) collected during clinical site visits. Head circumference was collected from a total of 19 deletion carriers and 18 duplication carriers. (b) Mean performance across domains of functioning for individuals with deletions, individuals with duplication, and familial noncarrier controls. Cognitive ability is represented as nonverbal and verbal IQ, and adaptive functioning is reflected by an overall adaptive composite. IQ and adaptive functioning estimates have a mean of 100 and standard deviation of 15. Mean values for motor ability, defined by Purdue T scores, phonological processing, defined by a nonword repetition task, and autism severity, defined by the comparison score, have been re-scaled to a mean of 100 and standard deviation of 15. Greater comparison scores signify increased autism severity. *Significant difference between deletion and duplication carriers.

