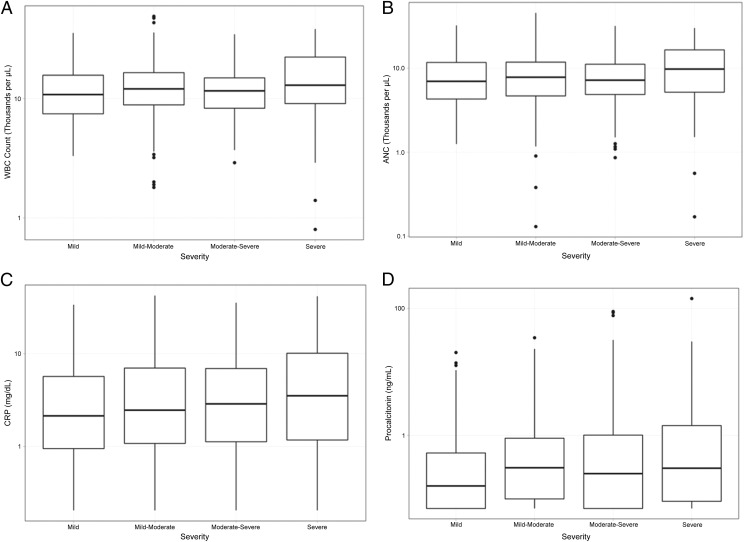
FIGURE 2.
Blood biomarkers and disease severity. The median biomarker concentration is represented by the middle line in each box. The lower and upper boarders of the box represent the 25th and 75th percentiles, respectively. A, WBC count (P = .24). B, ANC (P = .26). C, CRP (P = .6). D, Procalcitonin (P = .21).

