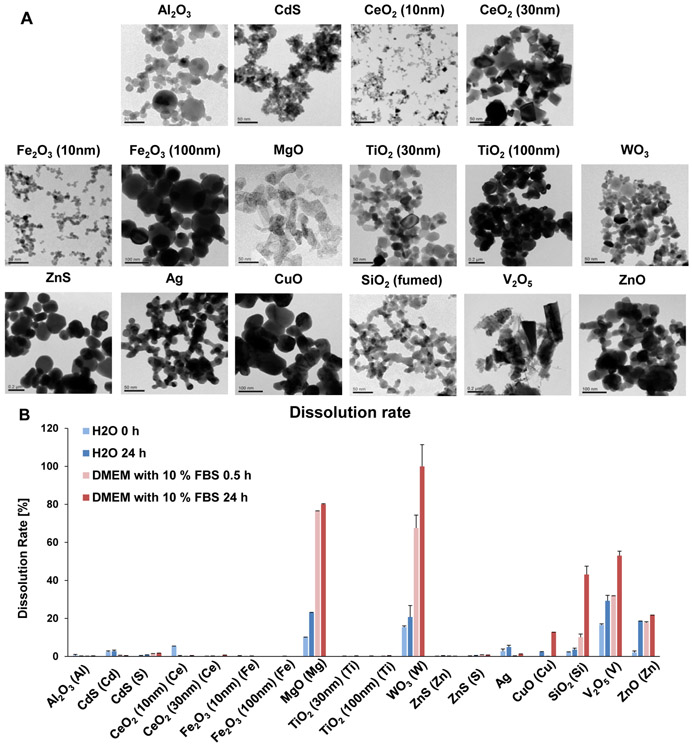
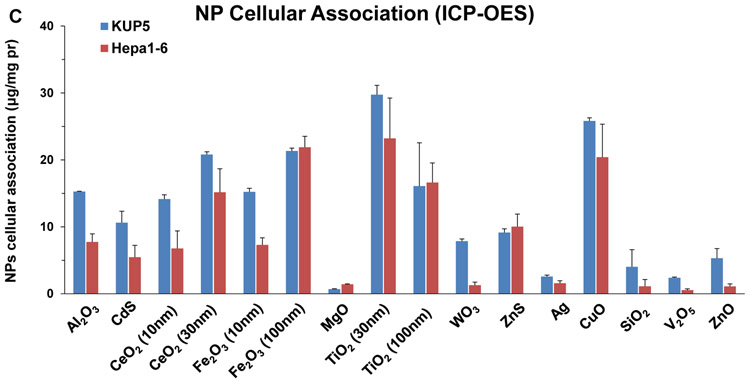
Figure 1. Characterization of nanoparticle morphology, dissolution characteristics, and cellular uptake.
(A) TEM images of 16 nanoparticles provided by the consortium. The images were captured using a JEOL 1200-EX TEM with accelerating voltage of 80 kV. (B) ICP-OES analysis of nanoparticle dissolution. The graph shows the % metal dissolution for the individual nanoparticles in water and complete DMEM (DMEM with 10 % FBS) at two time points (0 and 24 h). The analysis was performed by suspending 100 μg/mL of each material in deionized H2O, followed by incubation at 37 °C for 0 or 24 h. The supernatants were collected by centrifugation at 15, 000 g for 30 min and digested by concentrated nitric acid at 90 °C for 3 h. The digested solutions were dried by evaporation at 120 °C and dissolved in 3 mL of 5% nitric acid for ICP-OES analysis. (C) Cellular uptake of nanoparticles. After 4 h treatment with 12.5 μg/mL nanoparticles, KUP5 and Hepa 1–6 cell pellets were collected and acid digested for assessment of their metal content by ICP-OES.


