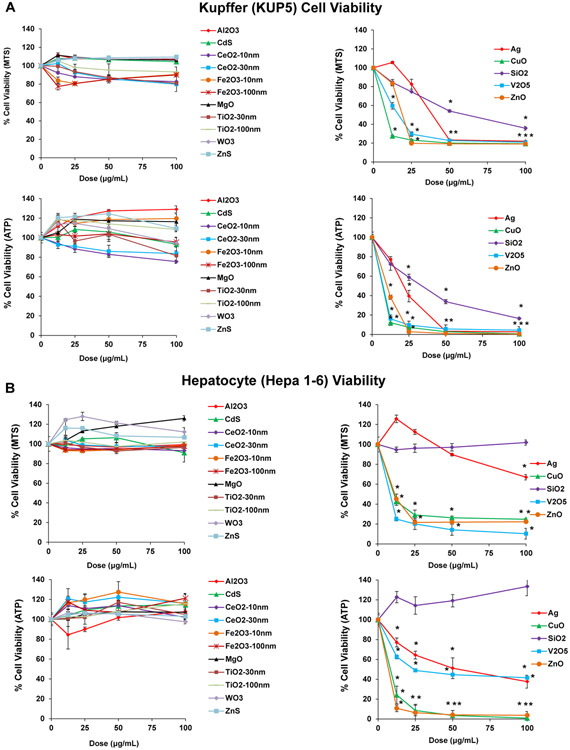
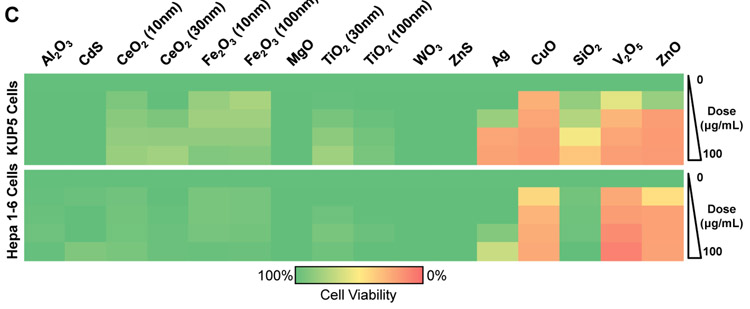
Figure 2. Cytotoxicity screening and cellular uptake of nanoparticles in KUP5 and Hepa 1–6 cells.
MTS and ATP assays were used to assess the viability of (A) KUP5 and (B) Hepa 1–6 cells after particle exposure at a dose range of 12.5–100 μg/mL for 24 h. The results are reported according to the material response characteristics. The left-hand panel shows profiling of nontoxic materials, while the right-hand panel shows the response to particles with significant toxicity. The viability of non-treated control cells was regarded as 100%. (C) Heat map display for KUP5 and Hepa 1–6 cells according to the color scale at the bottom. The heat map was generated by using Excel, based on the MTS viability data in (A) and (B). The viability of non-treated control cells was regarded as 100% and assigned green, while the 0% viability was assigned red.


