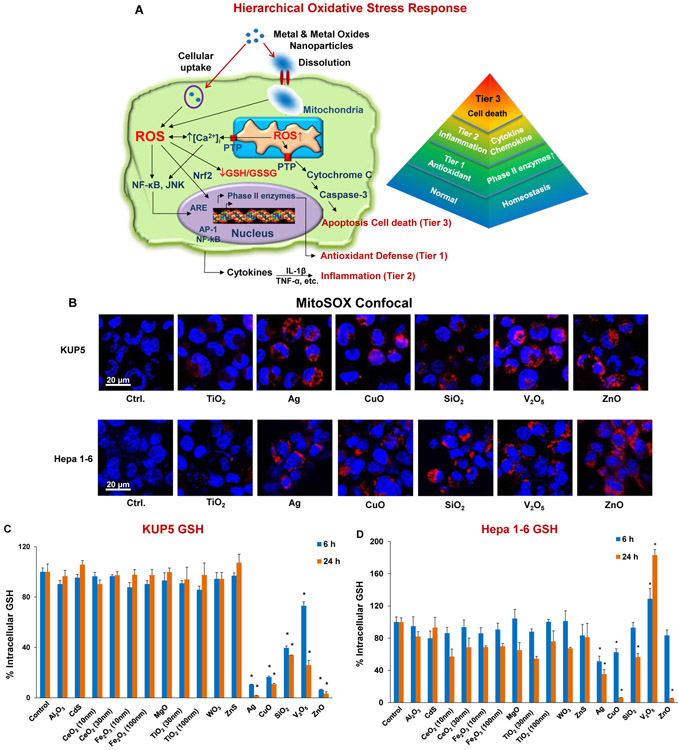
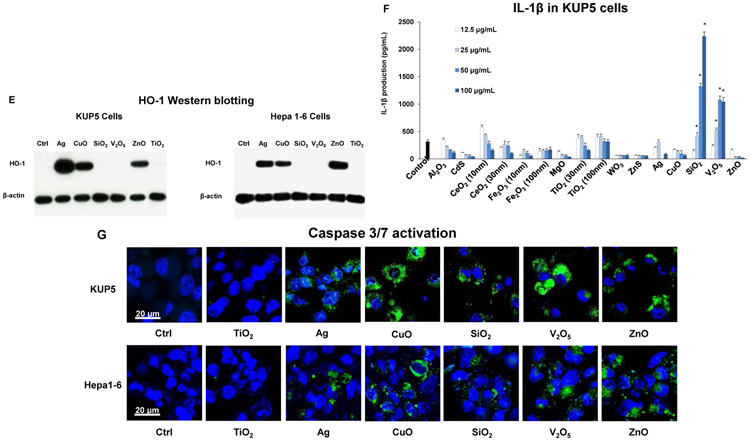
Figure 3. Cellular mitochondrial ROS generation and oxidative stress in KUP5 and Hepa 1–6 cells post-exposed to nanoparticles.
(A) Schematic to depict the hierarchical oxidative stress response to metals and metal oxide nanoparticles as previously elucidated for profiled nanomaterials.[23] Abbreviations in the schematic: JNK (c-Jun N-terminal kinases); ARE (Antioxidant Response Element); GSH (glutathione); AP-1 (activating protein-1); PTP (permeability transition pore). (B) Mitochondrial ROS generation was identified by MitoSOX red confocal microscopy following exposure to nanoparticles at 25 μg/mL for 5 h. Cells were stained with 5 × 10⁻⁶ M of MitoSOX for 20 min. The scale bar is 20 μm. (C and D) Impact on GSH levels as determined by the lmninescence-based GSH-Glo assay. KUP5 (C) and Hepa 1–6 (D) cells were treated with 50 μg/mL nanoparticles for 6 and 24 h. GSH levels were expressed as a percentage of the luminescence intensity compared to control cells (100%). (*) p < 0.05, compared to control. (E) HO-1 expression determined by immunoblotting. Both cell lines were treated with 12.5 μg/mL NPs for 6 h. (F) Dose-dependent IL-1β release by the full range of nanomaterials in KUP5 cells. LPS-primed (1 μg/mL, 4 h) KUP5 cells were exposed to nanoparticles (12.5–100 μg/mL) for 24 h. Supernatants were collected to measure IL-1β production by ELISA; *p < 0.05 compared to control cells. (G) Confocal microscopy images showing nanoparticle-induced caspases 3/7 expression in KUP5 and Hepa 1–6 cells. LPS-primed (1 μg/mL, 4 h) KUP5 and Hepa 1–6 cells were exposed to 25 μg/mL of chosen NPs for 5 h and stained with the FAM-FLICA caspase reagent for 1 h. Cell nuclei were stained with Hoechst 33342. The scale bar is 20 μm.


