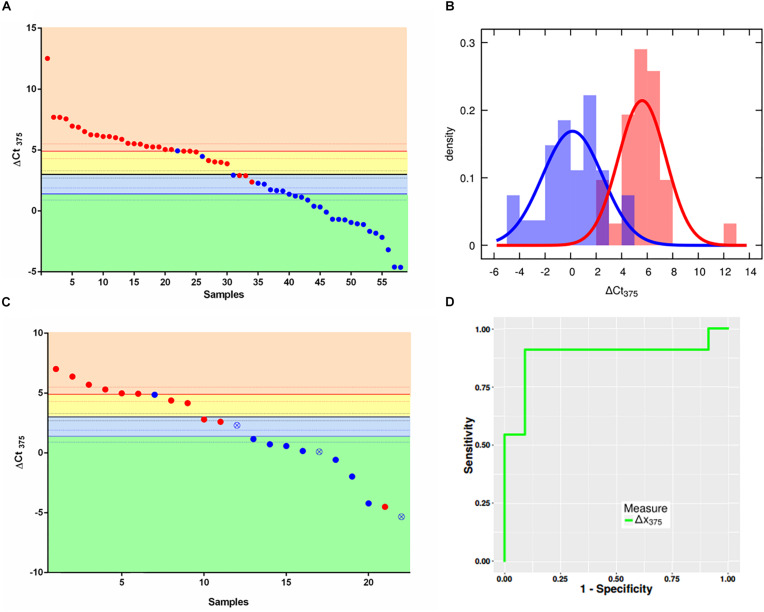
FIGURE 1.
ΔCt375 analysis of the training set and validation set samples. (A) Scatter plot for ΔCt375 analysis (Ctu6–Ct375) of the training set samples: color-code divides the low-grade NE (red) and non-NE (blue). The quantity ΔCt375 is able to discriminate low-grade NE from non-NE with 92.6% of sensitivity and 90.4% of specificity. (B) Probability density functions of ΔCt375 relative expression for low-grade NE (red) and non-NE (blue). (C) Scatter plot for ΔCt375 analysis of the validation set samples: color-code divides the low-grade NE (red) and non-NE (blue). Empty-crossed circles represent technical outliers. (D) ROC curve for ΔCt375 which results in an AUC = 0.88.

