Figure 5.

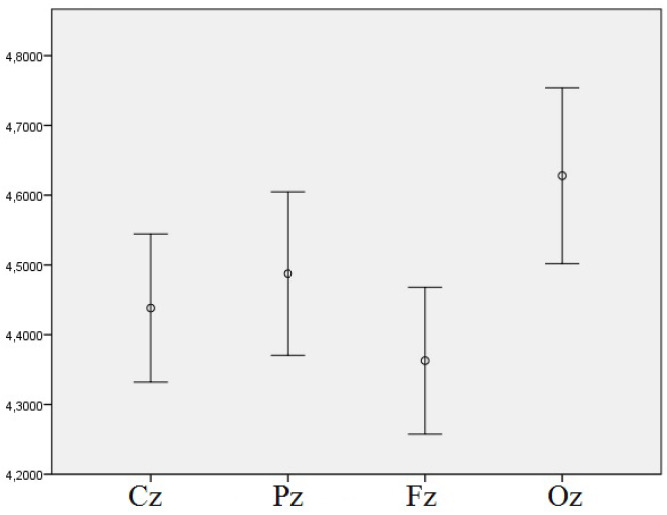
Means of log-transformed theta EEG power density in the 5th phase of the experiment and different derivations with error bars representing ± 1 SE, regardless of the light conditions.

Means of log-transformed theta EEG power density in the 5th phase of the experiment and different derivations with error bars representing ± 1 SE, regardless of the light conditions.