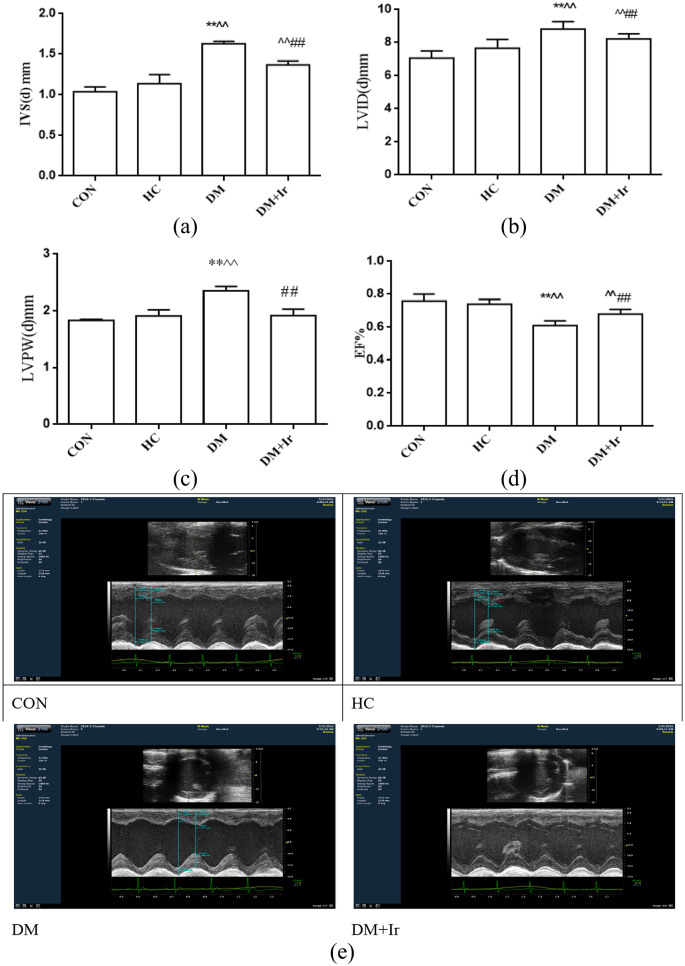
Figure 2.
The heart functions in the different groups (mean±SD, n=6). The (a) IVS(d), (b) LVID(d), (c) LVPW(d) and EF% in different groups. (e) Typical echocardiographic images in the different groups.
**p<0.01 vs. CON
^^p<0.01 vs. HC
##p<0.01 vs. DM.
CON: control group; HC: high glucose and high fat group; DM: diabetes group; DM+Ir: diabetes+irbesartan group; IVS(d): interventricular septum diameter; LVID(d): left ventricular internal diameter at end-diastole; LVPW(d): left ventricular posterior wall diameter; EF%: ejection fraction percentage.

