Figure 2.
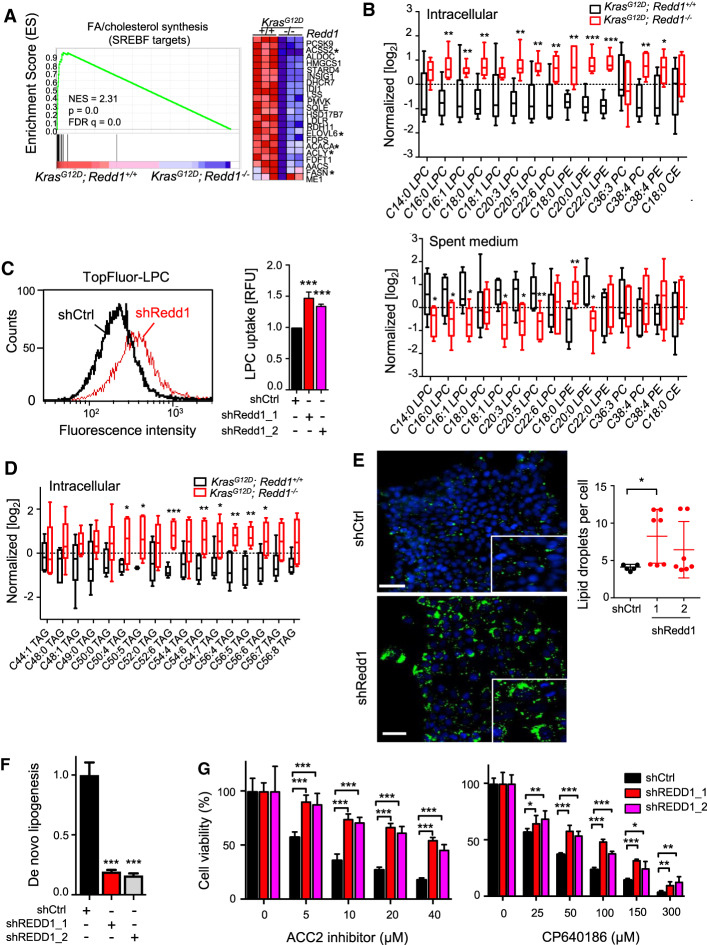
REDD1 deficiency activates lipid uptake and suppresses de novo lipogenesis. (A) Gene set enrichment analysis (GSEA) reveals SREBF targets (signature M3009) as the most significantly differentially expressed signature. (Left) GSEA plot of RNA-seq data showing suppression of fatty acid (FA) and cholesterol synthesis genes in paired KrasG12D;Redd1−/− versus KrasG12D; Redd1+/+ primary MEFs (KRMEFs and KMEFs, respectively, cultured under hypoxia (1% O2, 18 h). (NES) Normalized enrichment score; (FDR) false discovery rate. (Right) Heat map of the entire gene signature shown at left. Asterisks indicate FA synthesis genes. (B) Levels of phospholipids in KMEFs and KRMEFs (top) and their spent medium (bottom) collected during growth under hypoxia (1% O2) for 18 h as detected by UHPLC-MS lipidomics analysis. Data were normalized by MetaboAnalyst. Vertical lines (whiskers) denote range, and boxes indicate one SD. Triplicate samples from two mice per genotype were analyzed. (LPC) Lysophosphatidylcholine; (LPE) lysophosphatidylethanolamine; (PC) phosphatidylcholine; (PE) phosphatidylethanolamine; (CE) cholesterol ester. (*) P < 0.05; (**) P < 0.01; (***) P < 0.001. (C) Histogram showing increased uptake of TopFluor-LPC in REDD1-ablated compared with control KRAS-activated primary pancreatic epithelial cells (KPECs) as assessed by flow cytometry. (Right) Quantification of relative fluorescence intensity (RFU) from seven independent experiments is shown as a histogram at the right. Error bars indicate SD. (***) P < 0.001. (D) Unsaturated long chain triglyceride (TAG) levels in KRMEFs compared with KMEFs under hypoxia as detected by lipidomic analysis. Vertical lines (whiskers) indicate range and boxes indicate one SD. Triplicate samples from two mice per genotype were analyzed. (E) Lipid droplet (LD) staining via LD540 (green) in shCtrl and shRedd1 KPECs cultured in hypoxia (1% O2) for 48 h and visualized by fluorescence microscopy. Nuclei were stained with DAPI (blue). (Right) Quantification of LD levels from at least five random fields (dots) of >200 cells/field per genotype. LD numbers were normalized to cell numbers (nuclei) quantitated by DAPI. (*) P = 0.013 by two tailed t-test. Scale bar, 20 µm. (F) De novo lipogenesis, determined from 14C-acetate incorporation in A549 cells stably expressing empty vector control (shCtrl) or shRNA (shREDD1). Error bars denote ±SD of three independent experiments. (G) Loss of REDD1 decreases reliance on FA synthesis. A549 cells were treated with the specific ACC2 inhibitor (ACC2i) {N-[1-(2′-{4-isopropoxyphenoxy}-2,5′-bithiazol-5-yl)ethyl] acetamide} or the isoform-nonselective ACC inhibitor CP640186 at denoted doses for 72 h. Error bars indicate SD from quintuplicate wells in each of three independent experiments. (*) P < 0.05; (**) P < 0.01; (***) P < 0.001 for all graphs unless noted otherwise. See also Supplemental Figure S2.

