Figure 5.
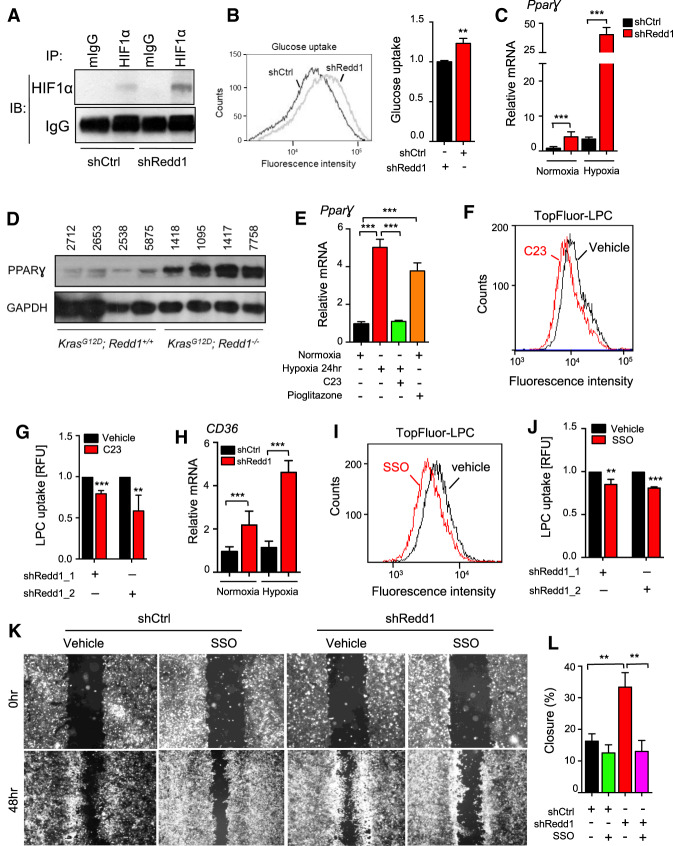
REDD1-dependent HIF1α activation induces the PPARγ-CD36 fatty acid transport pathway and promotes cell migration. (A) Knockdown of REDD1 in primary KPECs increases the protein level of HIF1α as detected by IP/Western analysis. IgG serves as a control for IP. (B) Histogram showing increased uptake of fluorescent glucose analog 2-NBDG in REDD1-ablated KPECs, assessed by flow cytometry. (Right) Summary data from three independent experiments. (C) mRNA expression levels of PPARγ in KPECs following shCtrl and shRedd1, as measured by qRT-PCR. Cells were cultured under normoxia or hypoxia (1% O2) for 18 h. Graph shows mean of two experiments performed in duplicate. (D) Western analysis of primary tumors from AdK and AdKR mice, demonstrating an increase in PPARγ protein in the absence of REDD1. (E) Cotreatment with HIF1α inhibitor C23 (60 µM) blocks induction of PPARγ under hypoxia (1% O2) for 24 h in shRedd1 primary KPECs, as measured by qRT-PCR. Pioglitazone serves as a positive control for PPARγ induction. (F) C23 treatment (40 µM) for 12 h decreased uptake of Topfluor-LPC in shRedd1 primary KPECs as measured by flow cytometry. (G) Summary of three independent experiments performed as in F, using two distinct REDD1-directed shRNAs. (H) mRNA expression levels of CD36 in shCtrl and shRedd1 primary KPECs, as measured by qRT-PCR. Cells were cultured under normoxia or hypoxia (1% O2) for 18 h. Graph shows mean of two experiments performed in duplicate. (I) CD36 inhibitor SSO (200 µM) for 12 h blocked uptake of Topfluor-LPC in shRedd1 primary KPECs as measured by flow cytometry. (J) Summary of three independent experiments performed as in I, using two distinct REDD1-directed shRNAs. (K) Representative images showing the scratch (wound) at time 0 and 48 h with and without SSO treatments (200 µM) in shRedd1 KPECs cultured under hypoxia (1% O2). Uniform cassette inserts were removed to create 0.9 mm wound at time 0 h. The same area was pictured on time 0 and 48 h. (L) Quantification of wound closure. Percent wound closure was measured using Image J. Shown are the means of three independent experiments. Error bars represent SEM. Unless otherwise noted, for all graphs. (**) P < 0.01; (***) P < 0.001, by two-tailed t-test. See also Supplemental Figure S5.

