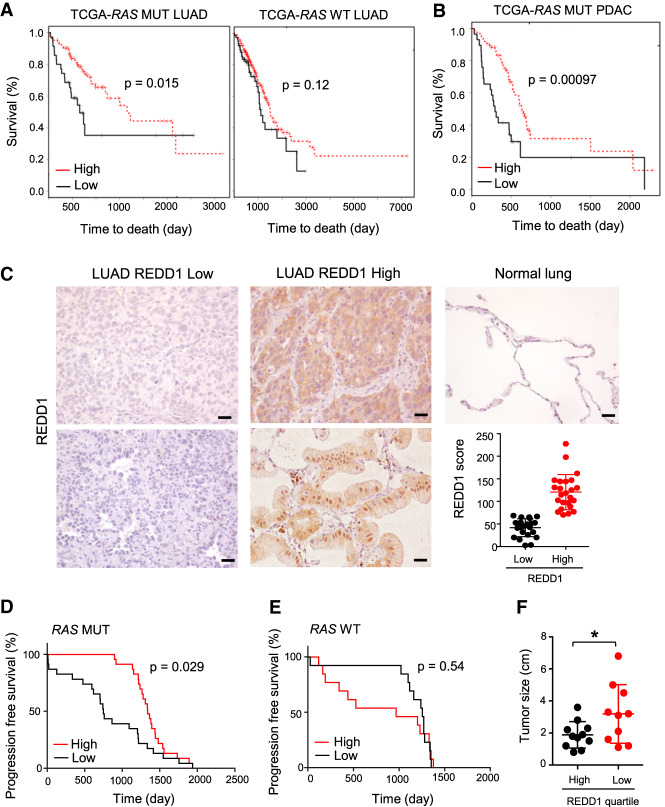
Figure 6.
Low REDD1 levels confer worse outcomes in RAS mutant human cancers. (A) Kaplan-Meier analysis of patient outcomes in the TCGA lung adenocarcinoma (LUAD) cohort, applying the REDD1 gene expression signature (see the text). (Left) Shorter survival is seen among RAS mutant LUAD patients with low REDD1 signature. Comparison of bottom (n = 35, median survival 656 d) and top (n = 104, median survival 1653 d) quartiles of metagene values. (Right) No significant difference in survival among RAS WT patients based on the REDD1 signature. Comparison of bottom (n = 77, median survival 1115 d) and top (n = 230, median survival 1499 d) quartiles of metagene values. P-values calculated by log-rank test. (B) Kaplan-Meier analysis of patient outcomes in the TCGA pancreatic adenocarcinoma (PDAC) cohort, applying the REDD1 signature. Shorter survival is observed among RAS mutant PDAC patients with low REDD1 signature. Comparison of bottom (n = 29, median survival 293 d) and top (n = 87, median survival 634 d) quartiles of metagene values. (C) IHC for REDD1 using affinity-purified anti-REDD1 antibody on lung adenocarcinomas (LUAD; n = 47 cases) and normal lung tissue. Representative photomicrographs of REDD1 low (left) and high (middle) LUAD cases. Scale bars, 20 µm. (Bottom, right panel) Distribution of REDD1 IHC scores among 47 cases. (D) Kaplan-Meier analysis of clinical outcomes based on tumor cell REDD1 protein expression, showing significantly shorter progression free survival (PFS) for patients with RAS mutant adenocarcinomas in the bottom 50% of REDD1 IHC scores (median PFS: 749 d) compared with the top 50% of REDD1 IHC scores (median PFS: 1338 d). P-values calculated by log-rank test. (E) Among RAS WT patients, no statistically significant difference in PFS is observed based on REDD1 protein expression. P-value by log-rank test. (F) Lower REDD1 protein expression is associated with larger primary tumors. Shown are tumors in the top and bottom quartiles of REDD1 expression. (*) P = 0.045 by two tailed t-test.

