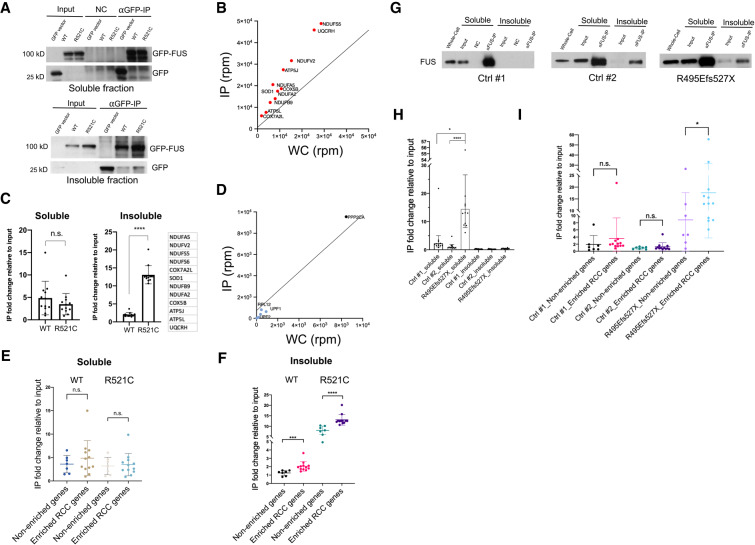
Figure 2.
RCC mRNAs are preferentially associated with ALS mutant FUS in transfected human cells and ALS patient fibroblasts. (A) HEK293T were transfected with GFP-tagged wild-type and R521C mutant FUS followed by fractionation. Western blot of GFP-FUS IP performed with soluble and insoluble fractions using GFP antibody. (B) Scatter plot depicts RCC mRNAs enriched in the insoluble mutant FUS IP and are linked to neurodegenerative disease pathways. NDUFS6 is outside the vertical axis range. (C) RT-qPCR of the listed 12 RCC genes in soluble and insoluble fractions. Each point represents mean RNA fold change in IP relative to input fraction, then normalized to GFP transfected control cells. Data are shown in mean ± SD from three independent experiments. (****) P < 0.0001, Mann-Whitney U-test. (D) Scatter plot depicts neither and nonenriched RNAs in the insoluble mutant FUS IP. mRNAs shown are INTS4, UPF1, UPF2, RPL12, SMG1, and PPP2CA. (E,F) RNAs associated with GFP-tagged wild-type and R521C mutant FUS were extracted from soluble (E) and insoluble (F) fractions followed by RT-qPCR. IP fold changes of 12 RCC transcripts are compared with seven control transcripts (INTS4, UPF1, UPF2, RPL12, SMG1, PPP2CA, and 18S) that are non-enriched or not expected to be preferentially bound by mutant FUS. Data are shown in mean ± SD from three independent experiments. (***) P < 0.001; (****) P < 0.0001, Mann-Whitney U-test. (G) Western blot of FUS IP from the soluble and insoluble fractions from wild-type and R495Efs527X mutant FUS patient fibroblasts using antibody against FUS. (H) RNAs associated with wild-type and R495Efs527X mutant FUS were extracted from soluble and insoluble fractions. RT-qPCR of the listed 12 RCC genes described in C. Each point represents mean RNA fold change in IP relative to input fraction. (*) P < 0.05; (****) P < 0.0001, Mann-Whitney U-test. (I) RNAs associated with wild-type and R495Efs527X mutant FUS were extracted from soluble fraction followed by RT-qPCR. IP fold changes of the 12 RCC transcripts are compared with seven control transcripts (IGFBP3, NSUN5, MST1, ZFAND4, AAMP, ABCA7, and NEFH) that are shown to be depleted in 3′READS analysis (Supplemental Table S2) or previously shown not to be selectively bound by mutant FUS (Coady and Manley 2015). Data are displayed in mean ± SD. (*) P < 0.05, Mann-Whitney U-test.

