Figure 5.
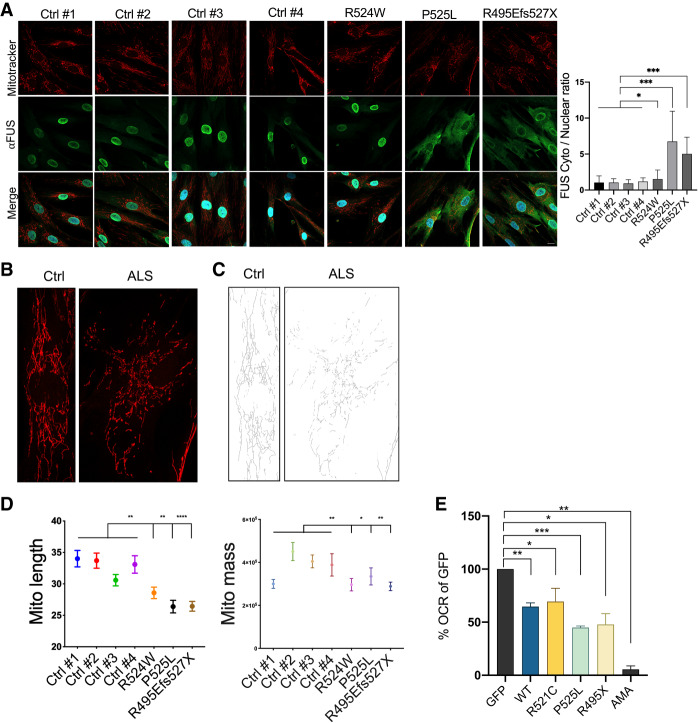
Expression of ALS mutant FUS or overexpression of wild-type FUS induces mitochondrial dysfunction. (A) The indicated human fibroblasts were incubated with 100 nM MitoTracker Red CMXRos for 30 min followed by immunofluorescence to detect FUS proteins. Cytoplasmic to nuclear FUS protein ratio quantitation is shown in mean with error bar SD. N = 174. (*) P < 0.05; (***) P < 0.001, Mann-Whitney U-test. Scale bar, 15 µm. (B) Zoom-in images of mitochondrial network morphology of FUS wild-type and mutant fibroblasts. (C) Binary skeletonized images of mitochondrial network shown in B. (D) Mitochondrial network branch lengths and footprint/mass quantification in wild-type and mutant fibroblasts. N = 170. (*) P < 0.05; (**) P < 0.01; (****) P < 0.0001, one-way ANOVA test. (E) O2 consumption rate of WT and ALS mutant FUS transfected 293T cells were normalized to GFP vector control in percentage. Data are displayed in mean with SE from four independent experiments. Statistics: unpaired t-test. (*) P < 0.05; (**) P < 0.01; (***) P < 0.001. (AMA) Antimycin A.

