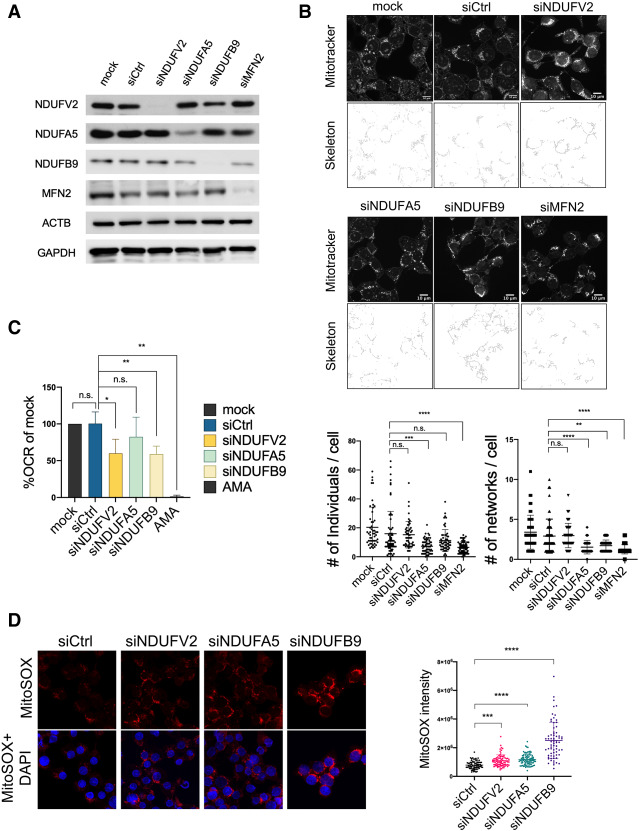
Figure 6.
Depletion of RCC proteins disrupts mitochondrial networks and inhibits aerobic respiration. (A) NADH dehydrogenase subunit siRNA knockdowns in HEK293T cells for 72 h, followed by Western blot (WB) and MitoTracker Red CMXRos (100 nM) incubation for 30 min. (B) Mitochondrial network images of siRNA transfected cells. Networks are shown in binary skeletonized images. Dot plots show the quantification of unbranched mitochondria (number of individuals) and branched mitochondrial networks (number of networks) of each cell. MitoTracker quantification: >300 cells are analyzed. Scale bar, 10 µm. (**) P < 0.01; (***) P < 0.001; (****) P < 0.0001, Mann-Whitney U-test. (C) O2 consumption rate of NADH dehydrogenase subunit knockdown cells. (AMA) Antimycin A. Data are displayed in mean with SD from four independent experiments. (*) P < 0.05; (**) P < 0.01, unpaired t-test. (D) Mitochondrial ROS level in NADH dehydrogenase subunit knockdown cells. MitoSOX signal intensities were analyzed in 307 cells. (***) P < 0.001; (****) P < 0.0001, Mann-Whitney U-test.

