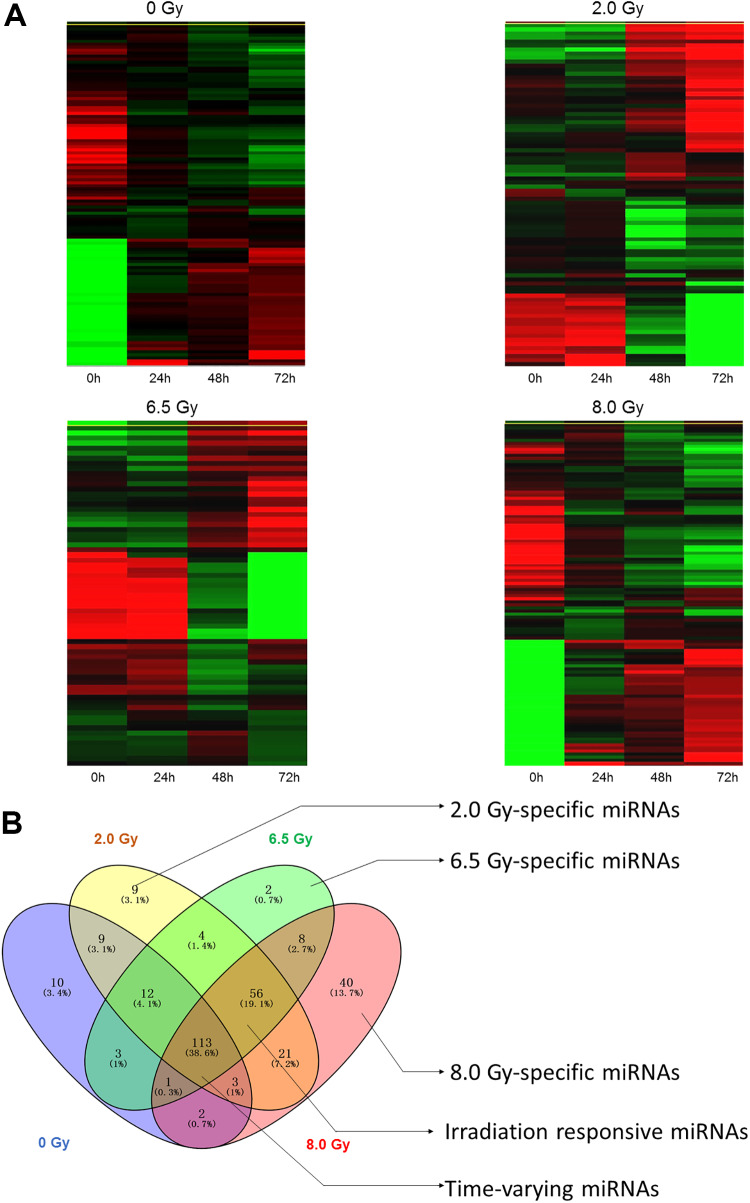
Figure 2.
Differential expression of microRNAs in serum exosomes between control, 2.0 Gy, 6.5 Gy, and 8.0 Gy groups. A, The hierarchical clustering of differentially expressed microRNAs. B, Venn diagrams indicated the numbers of overlapping and nonoverlapping differentially expressed microRNAs in serum exosomes after 0, 2.0, 6.5, and 8.0 Gy exposure.

