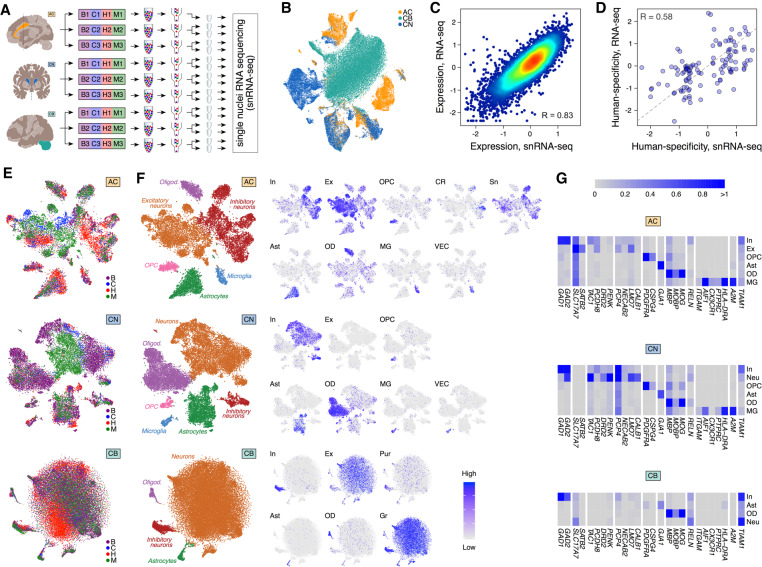
Figure 3.
Single-nuclei transcriptomics in three brain regions. (A) Design of the snRNA-seq experiment. (B) t-SNE plot of 88,047 single nuclei colored by brain regions after integration with Seurat 3.0 (Stuart et al. 2019). (C) Correlation of gene expression levels between bulk RNA-seq and averaged snRNA-seq data sets in human AC. Dots represent genes, and colors show the density of the dots. (D) Correlation of human-specificity ratios between bulk RNA-seq and averaged snRNA-seq data sets in AC for genes passing the human-chimpanzee difference cutoff in either data set. Each dot represents a gene. The dashed line indicates the linear relationship with a slope of 1 and an intersect of 0. (E) t-SNE plot of nuclei colored by species in each of the three brain regions after integration with Seurat 3.0 (Stuart et al. 2019). (F) The cumulative cell-type annotation of t-SNE clusters (left) and projection of expression levels averaged across cell-type marker genes onto the t-SNE plots. Abbreviations next to t-SNE plots mark cell types: (In) inhibitory neurons; (Ex) excitatory neurons; (Sn) spindle neurons; (Pur) Purkinje cells; (OPC) oligodendrocyte progenitor cells; (Ast) astrocytes; (OD) oligodendrocytes; (CR) Cajal-Retzius cells; (MG) microglia; (VEC) vascular endothelial cells. (G) Average expression levels of cell-type marker genes in t-SNE clusters. The same marker genes were used in F.

