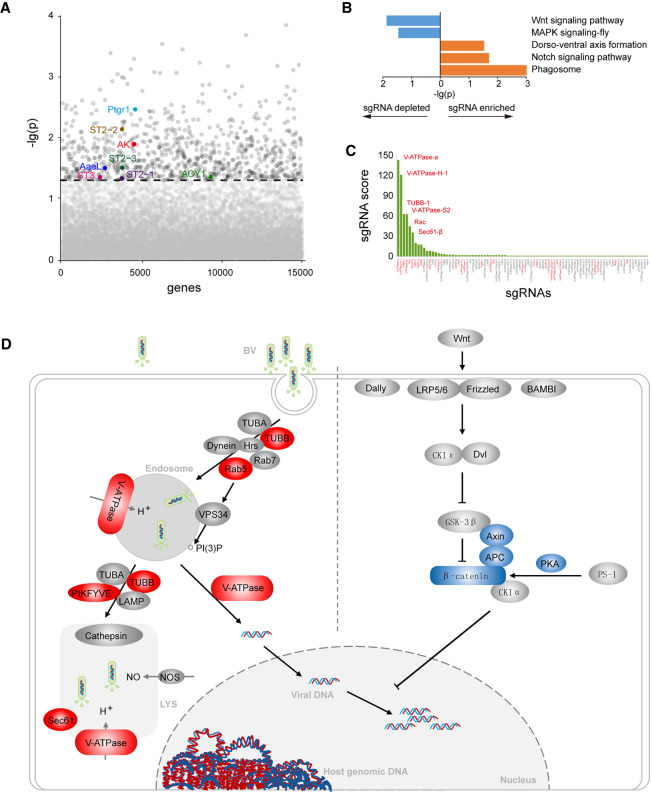
Figure 6.
Screening of genes involved in the interaction between BmE cells and B. mori nucleopolyhedrovirus (BmNPV). (A) Plot of genes ranked by negative score. The portion of genes that associated with virus resistance are highlighted. (B) Genes for BmE-BmNPV interactions uncovered by the KEGG pathway analysis. (C) sgRNA score of genes in the phagosome pathway. (D) Schematic of B. mori cell interactions with BmNPV.

