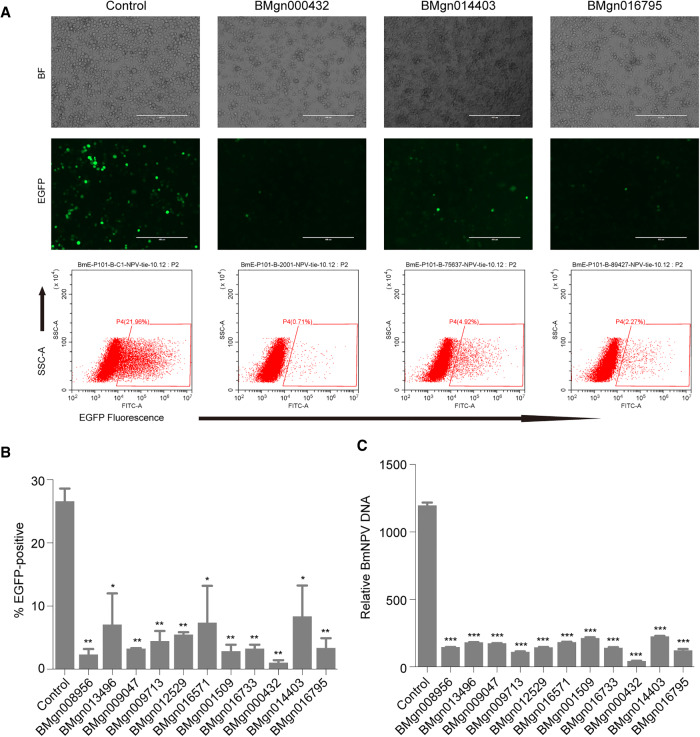
Figure 7.
Functional analysis of genes involved in B. mori-BmNPV interactions. (A) Fluorescent images analysis (upper) and flow cytometry analysis (lower) of the BmE knockout cells infected with BmNPV at an MOI of 1. (B,C) Statistical flow cytometry analysis (B) and relative BmNPV DNA level (C) in 11 BmE knockout cells infected with BmNPV at an MOI of 1. Statistically significant differences were determined by Student's t-test: (*) P < 0.05; (**) P < 0.01; (***) P < 0.001.

