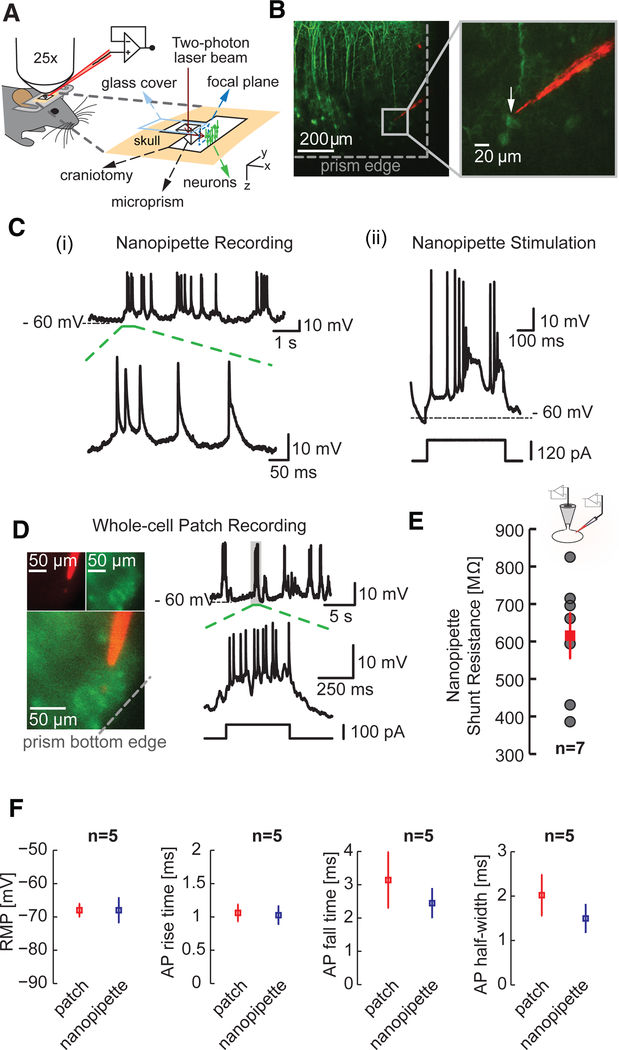
Figure 2. Targeted Intracellular Recordings from Layer 5 Neurons in the Visual Cortex of Lightly Anaesthetized Mice.
(A) Illustration showing the targeted intracellular recordings technique applicable across all cortical layers. A glass microprism (height, 1 mm; width, 1 mm) with a reflective coating along the slanted edge is implanted into the brain of a head-fixed mouse. Two-photon imaging through the prism allows the visualization of labeled neurons and enables the precise guidance of the quantum-dot-coated sharp nanopipette to the target cell.
(B) Targeted nanopipette recordings (type A entry) from thy1-YFP-labeled layer 5 pyramidal neurons (top, left) using the technique outlined in (A). The prism enables the precise guidance of the nanopipette to the target cell (inset, right) and simultaneous visualization of the entire cortical column up to layer 1.
(C) (i) Intracellular measurements from the targeted pyramidal shown in (B) and typical AP characteristics (dotted green section). (ii) Membrane depolarization elicited through current injection across the sharp nanopipette in bridge mode. The electrode artifact is extremely low.
(D) Targeted whole-cell patch-clamp recordings from layer 5 pyramidal neurons. Note the high access resistances.
(E) Nanopipette shunt resistance (red) of 615.29 ± 59.69 MΩ (mean ± SEM, n = 7) measured using simultaneous whole-cell patch and nanopipette recordings (type A) from somas of neurons (inset) in vitro (see text for details). Gray dots reflect all measured values.
(F) Comparison of RMP, AP rise time, decay, and half-width measured using whole-cell patch pipettes (red) and nanopipettes (blue). Plots reflect mean ± SEM.

