. 2020 Apr 14;295(3):616–625. doi: 10.1148/radiol.2020192210

Figure 3:

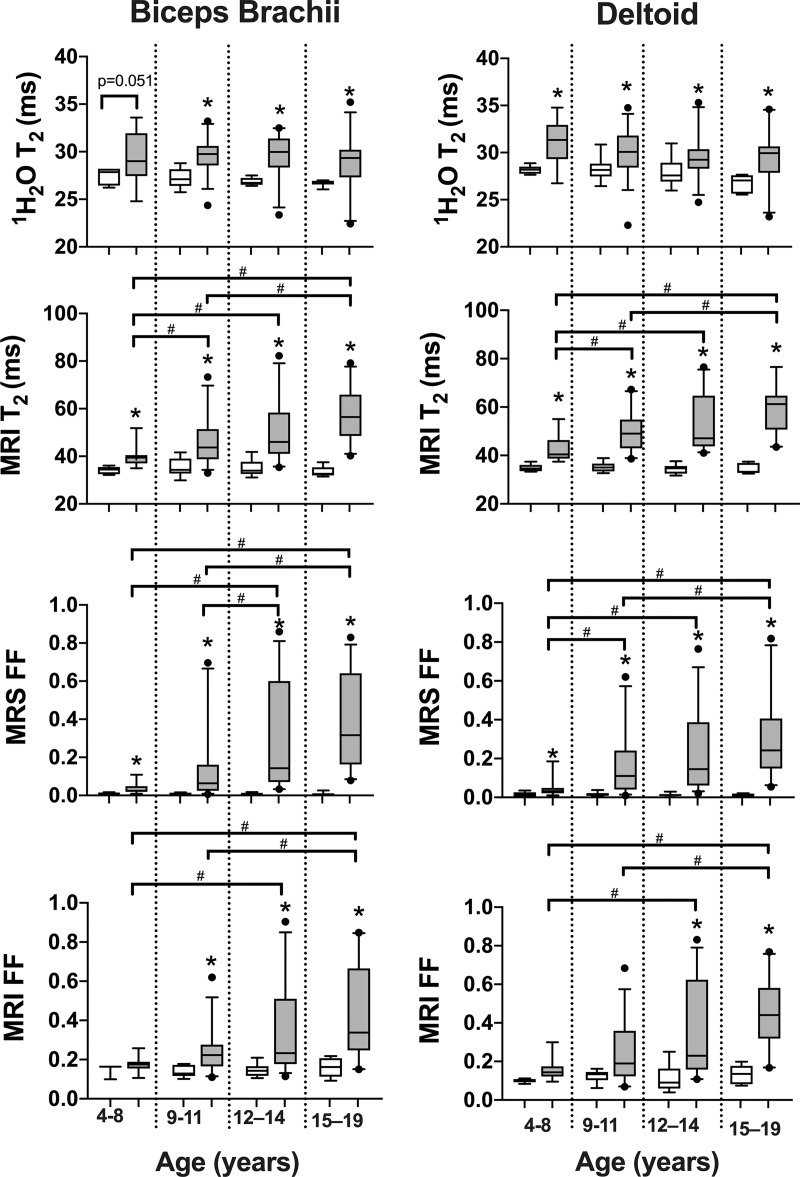
Box and whisker plots show proton (1H) MR spectroscopy (MRS) 1H2O T2 (msec), MRI T2 (msec), MR spectroscopy fat fraction (MRS FF), and chemical shift-encoded imaging fat fraction (MRI FF) of the biceps brachii and deltoid in control participants and participants with Duchenne muscular dystrophy (DMD) in different age groups. Statistical significance was defined as a P value less than the Bonferroni-corrected P value. No differences were observed among age groups in control participants. Whisker bars represent 5th and 95th percentiles and dots are shown for outliers. * Significantly different than controls. # Significantly different between age groups in participants with DMD.

Box and whisker plots show proton (1H) MR spectroscopy (MRS) 1H2O T2 (msec), MRI T2 (msec), MR spectroscopy fat fraction (MRS FF), and chemical shift-encoded imaging fat fraction (MRI FF) of the biceps brachii and deltoid in control participants and participants with Duchenne muscular dystrophy (DMD) in different age groups. Statistical significance was defined as a P value less than the Bonferroni-corrected P value. No differences were observed among age groups in control participants. Whisker bars represent 5th and 95th percentiles and dots are shown for outliers. * Significantly different than controls. # Significantly different between age groups in participants with DMD.