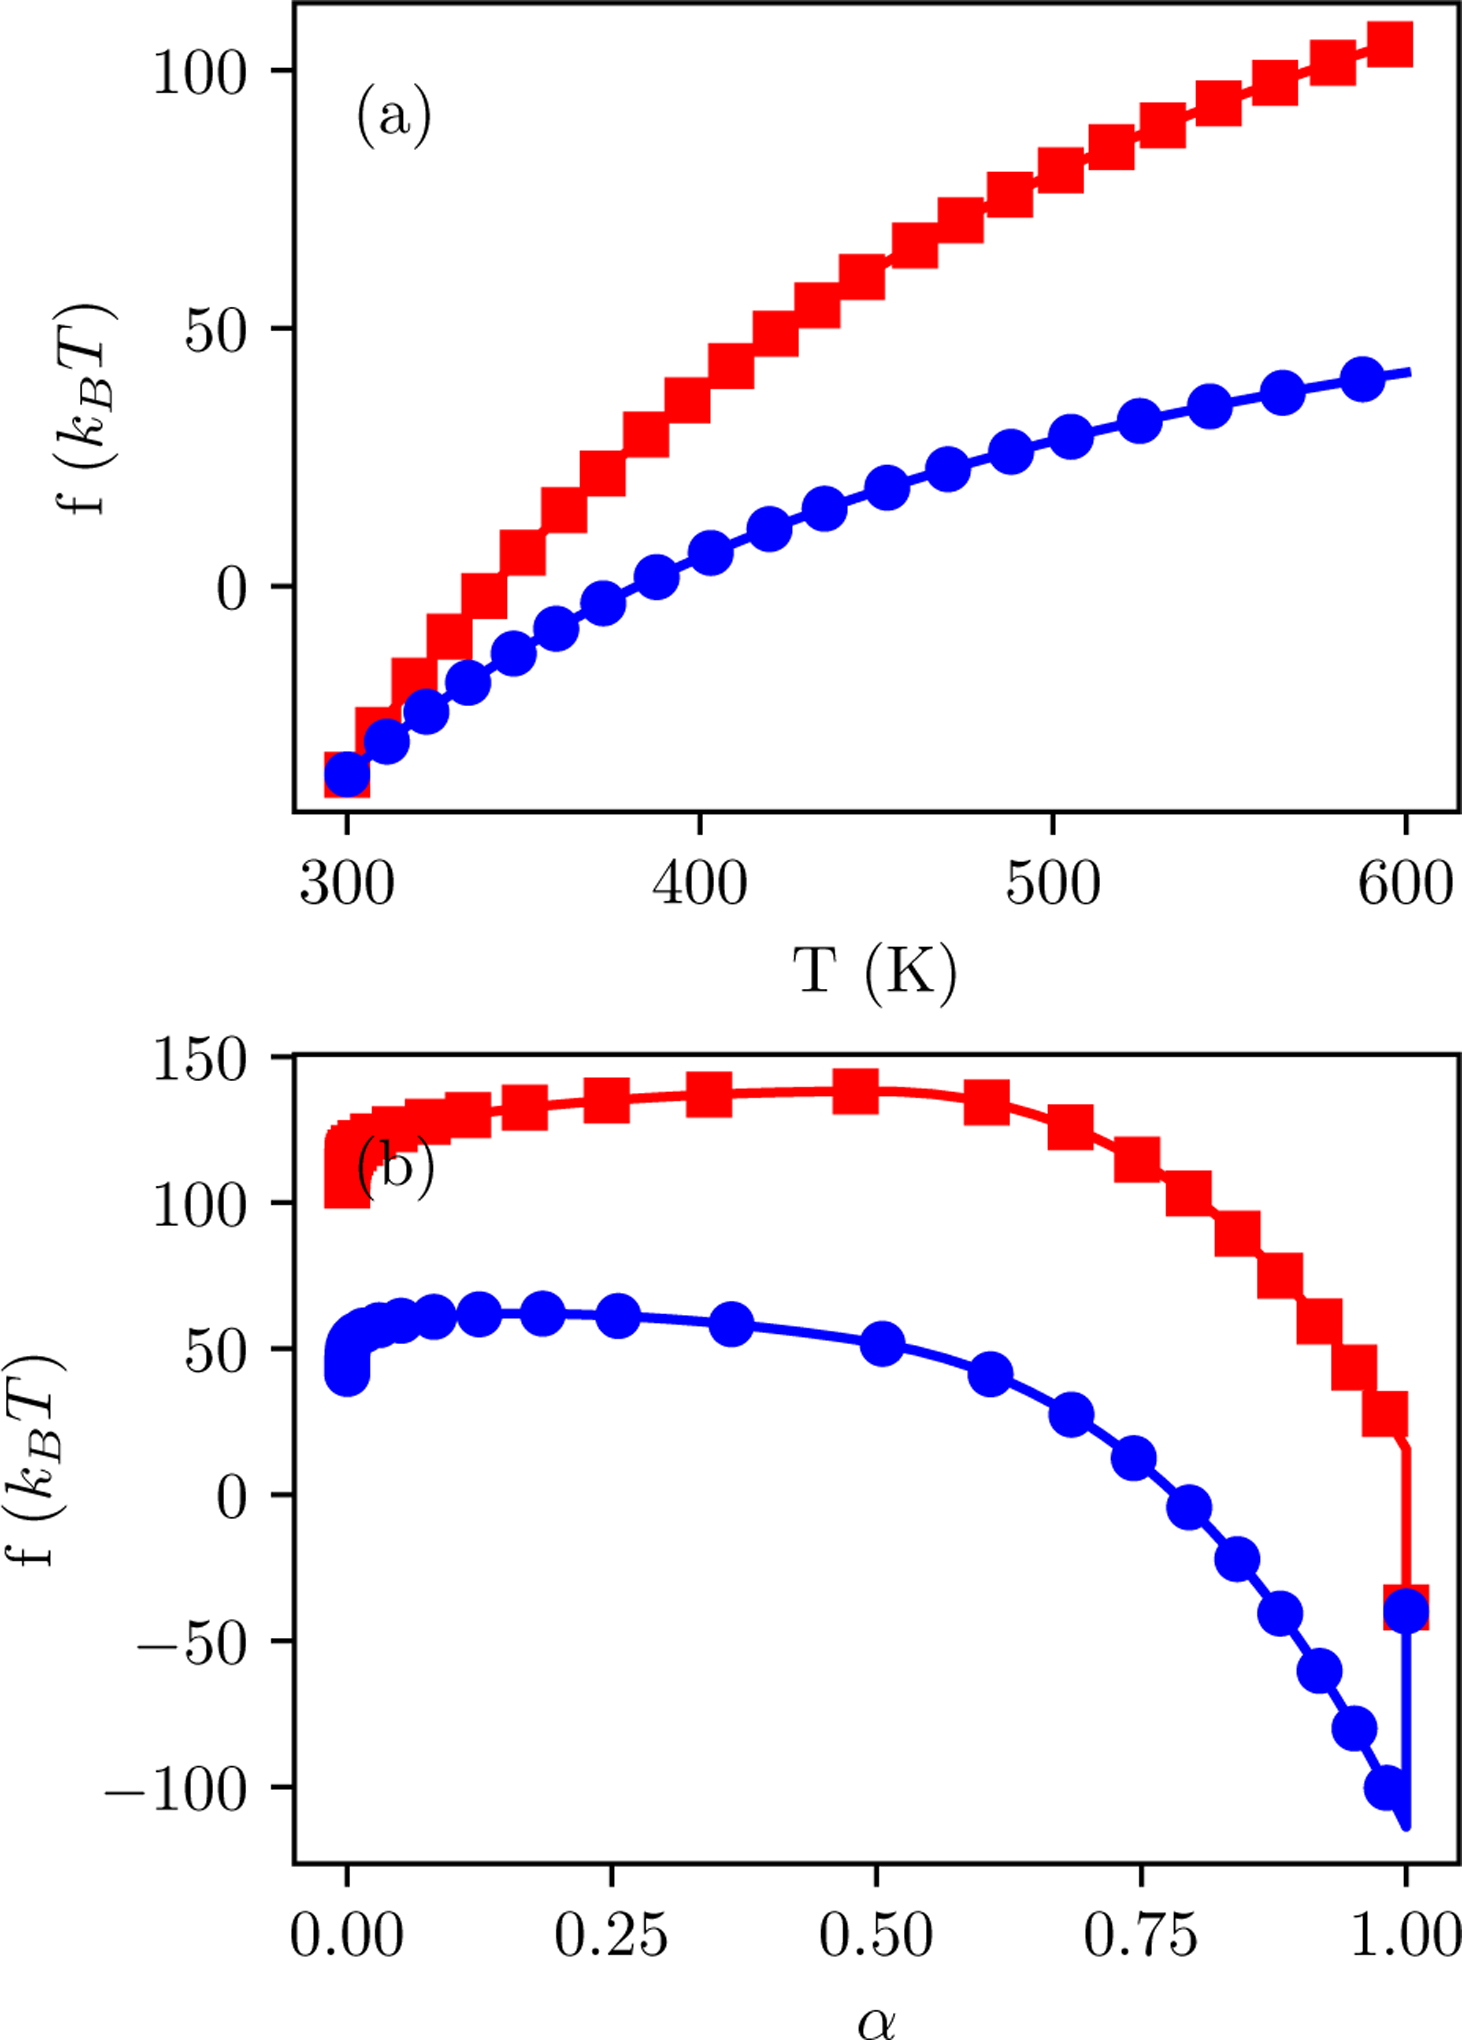
Figure 10:

Representative cumulative free energies as a function of progress for states (a) AC and (b) DE for Desolvated (red squares) or Full (blue circles) options. Simulations are of PDB ID 1gpk. Panel (a) is based on the sum of fAB and the free energy difference between TT = 300 K and the temperature on the x axis. Panel (b) is based on the sum of fAC and the free energy difference between α = 0 and the progress variable on the x axis. The final point on the plot shows fAE for both pathways. For clarity, markers are shown only every four thermodynamic states.
