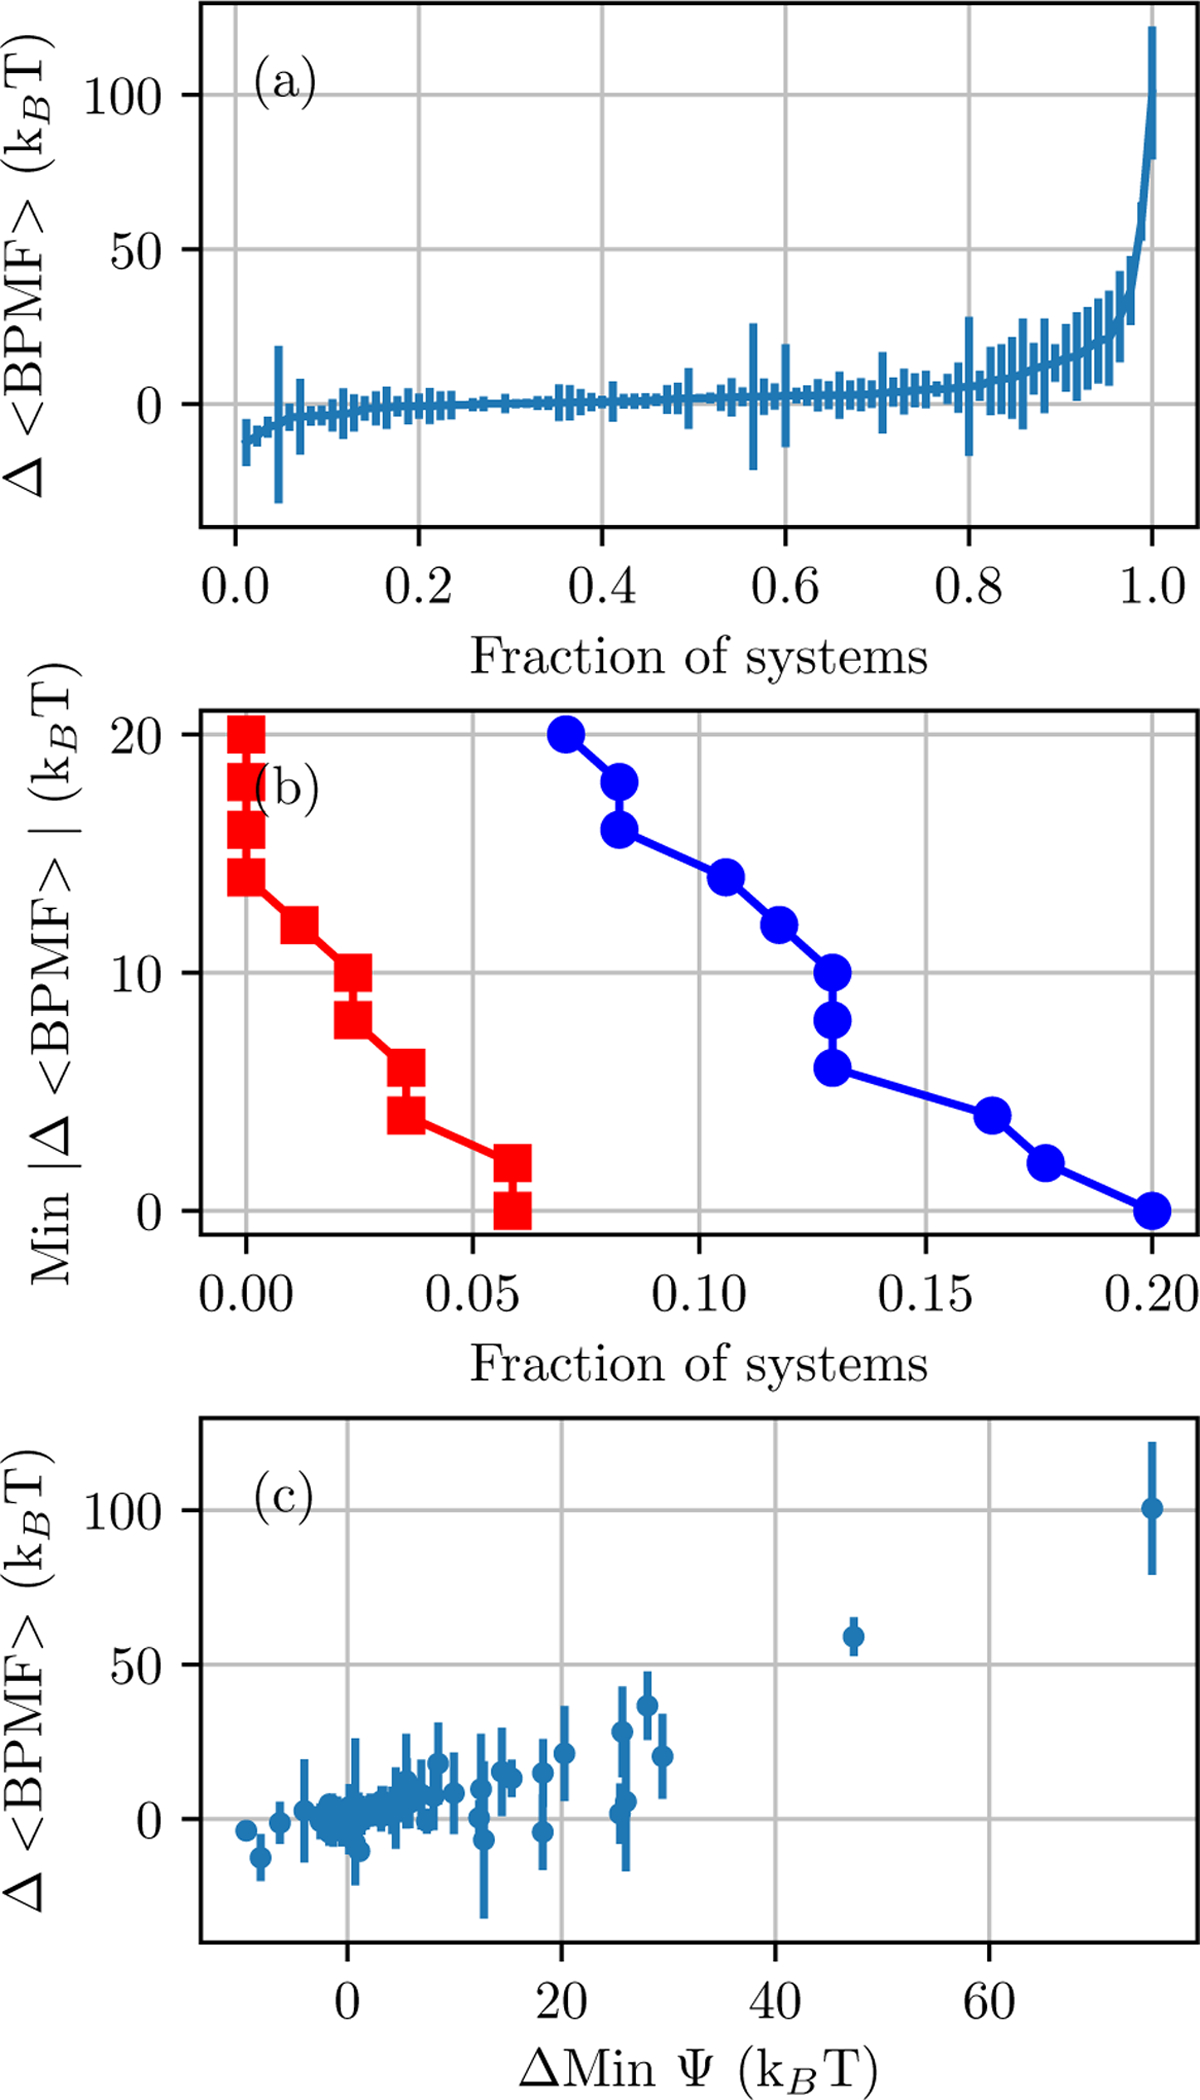
Figure 11: Differences between the mean BPMF of Desolvated and Full solvation options.

(a) Data points are ordered by the difference in mean BPMFs and the error bars are the sum of the standard deviations of the two estimates. (b) The fraction of systems in which the difference in mean BPMFs is larger than the sum of standard deviations of the two estimates. Either the Desolvated (red squares) or Full (blue circles) BPMF is lower by at least a certain value. (c) The difference in the minimum interaction energy, according to the force field in milestone E, versus the difference in mean BPMFs.
