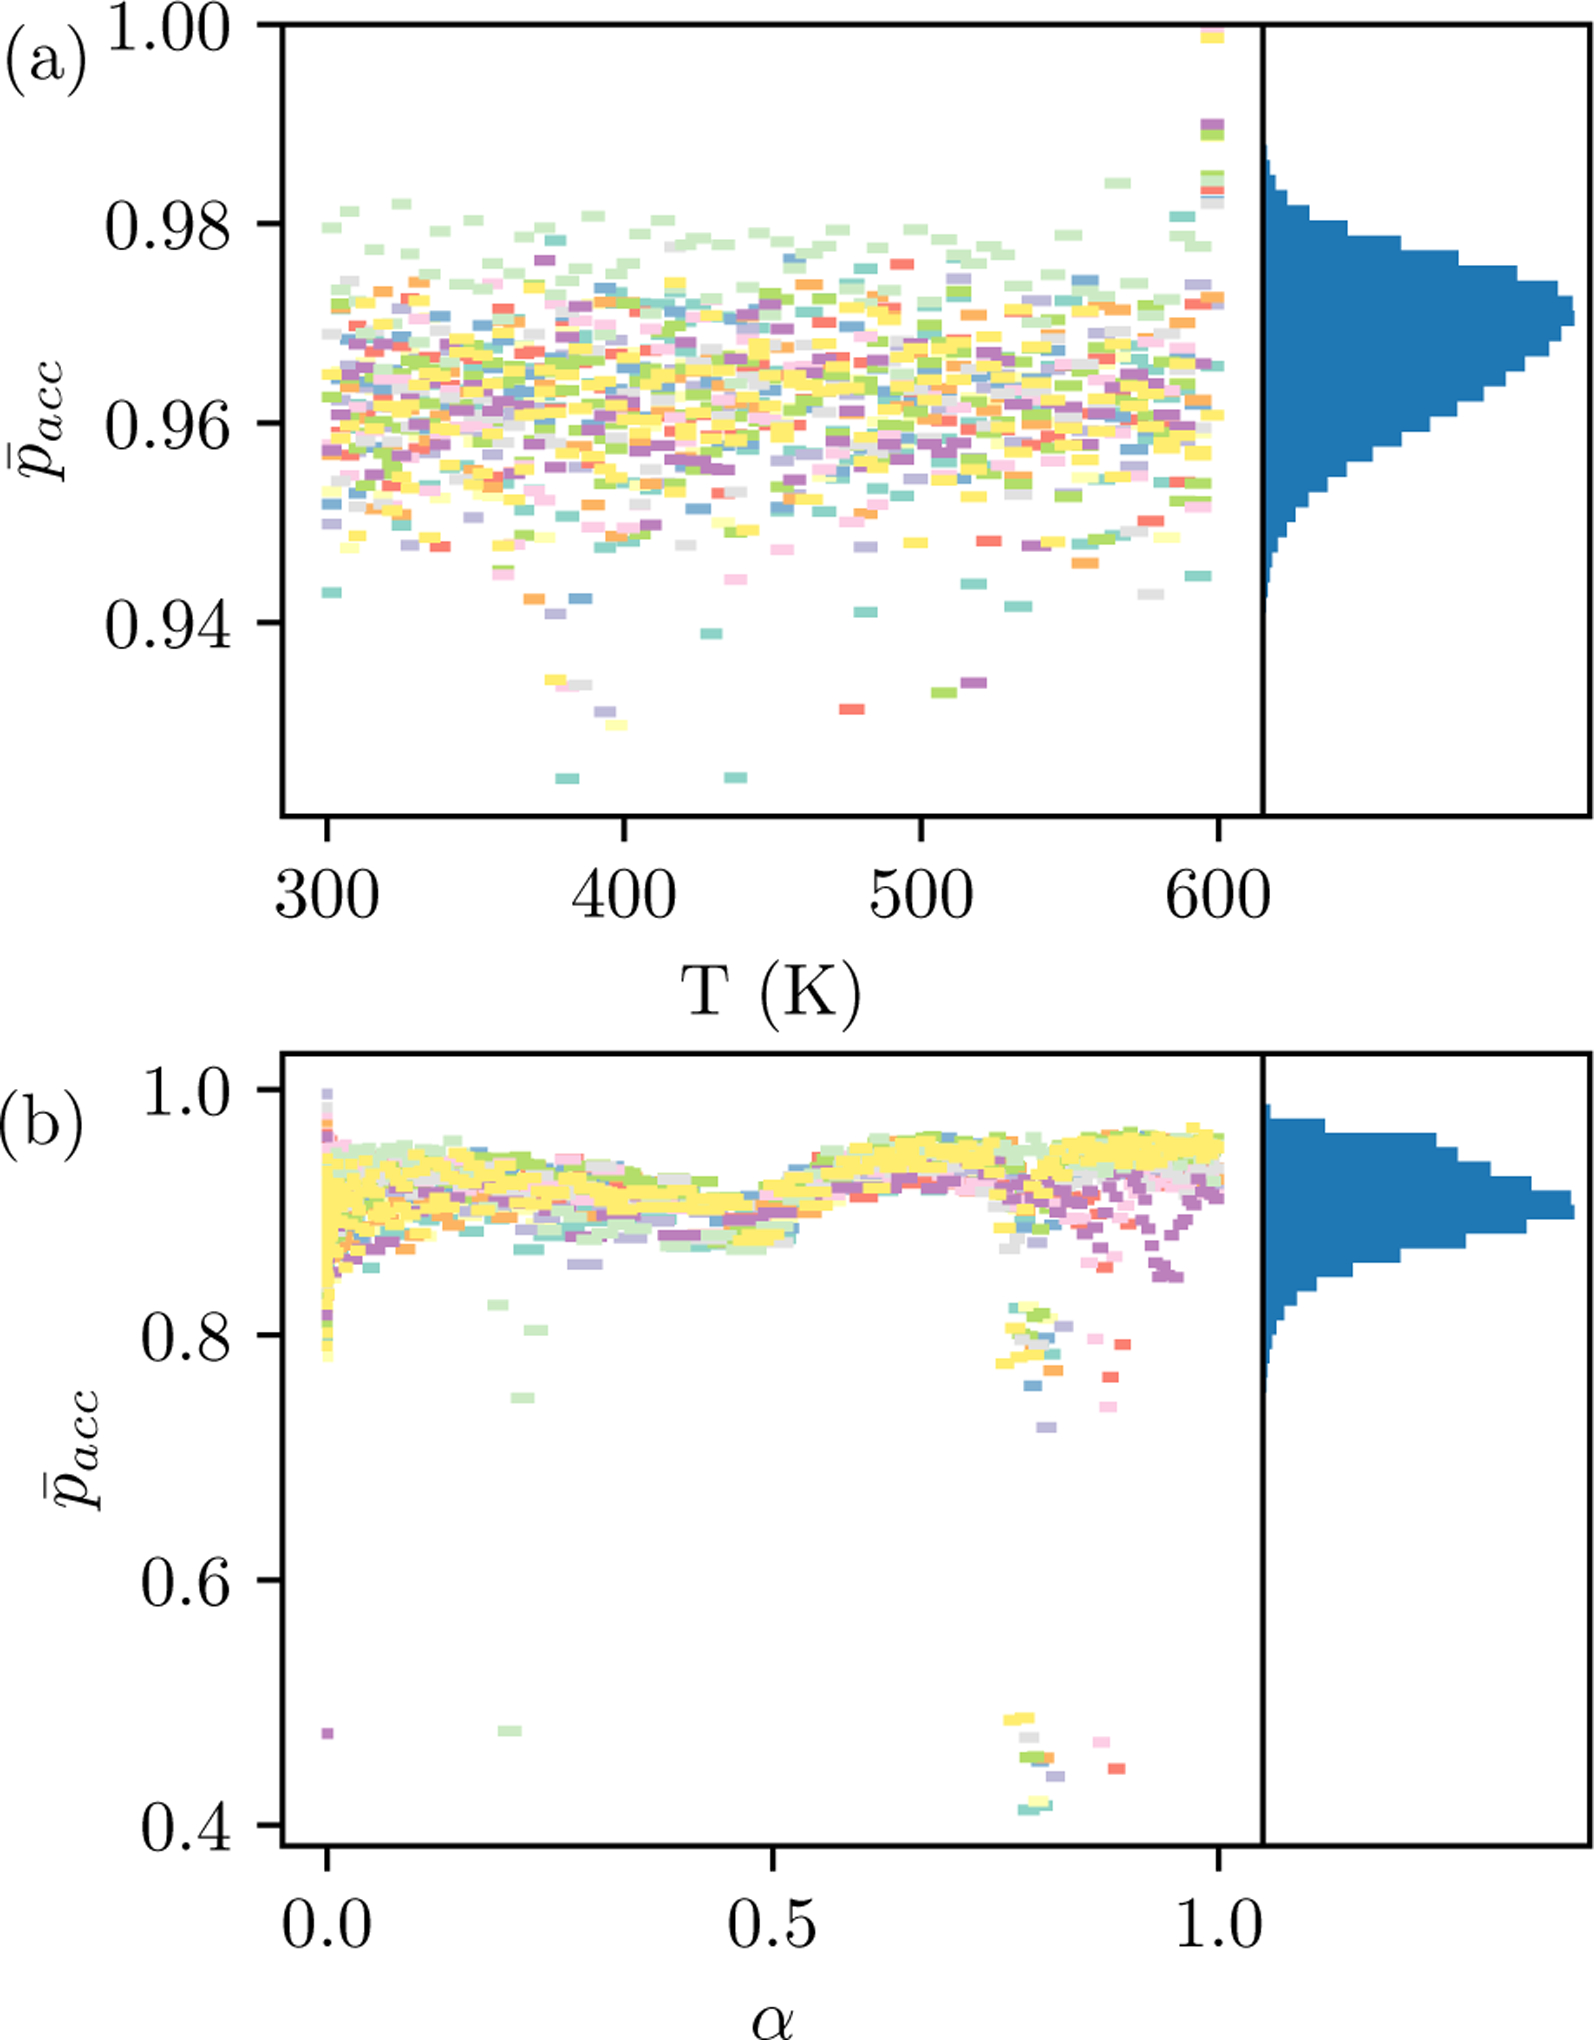
Figure 4: Mean acceptance probability statistics.

for fifteen protocols with the lowest observed (a) for states BC and (b) and states CD are shown with the a line connecting neighboring states. Histograms of from all simulations are shown on the right panel. The largest bin count is 14492 for states BC and 31068 for states CD. For states CD, the simulations are from 1opk (4), 1r1h (4), 1t40 (3), 1v48 (2), 1oq5 (1), 1jje (1), where the number of simulations is in the parentheses.
