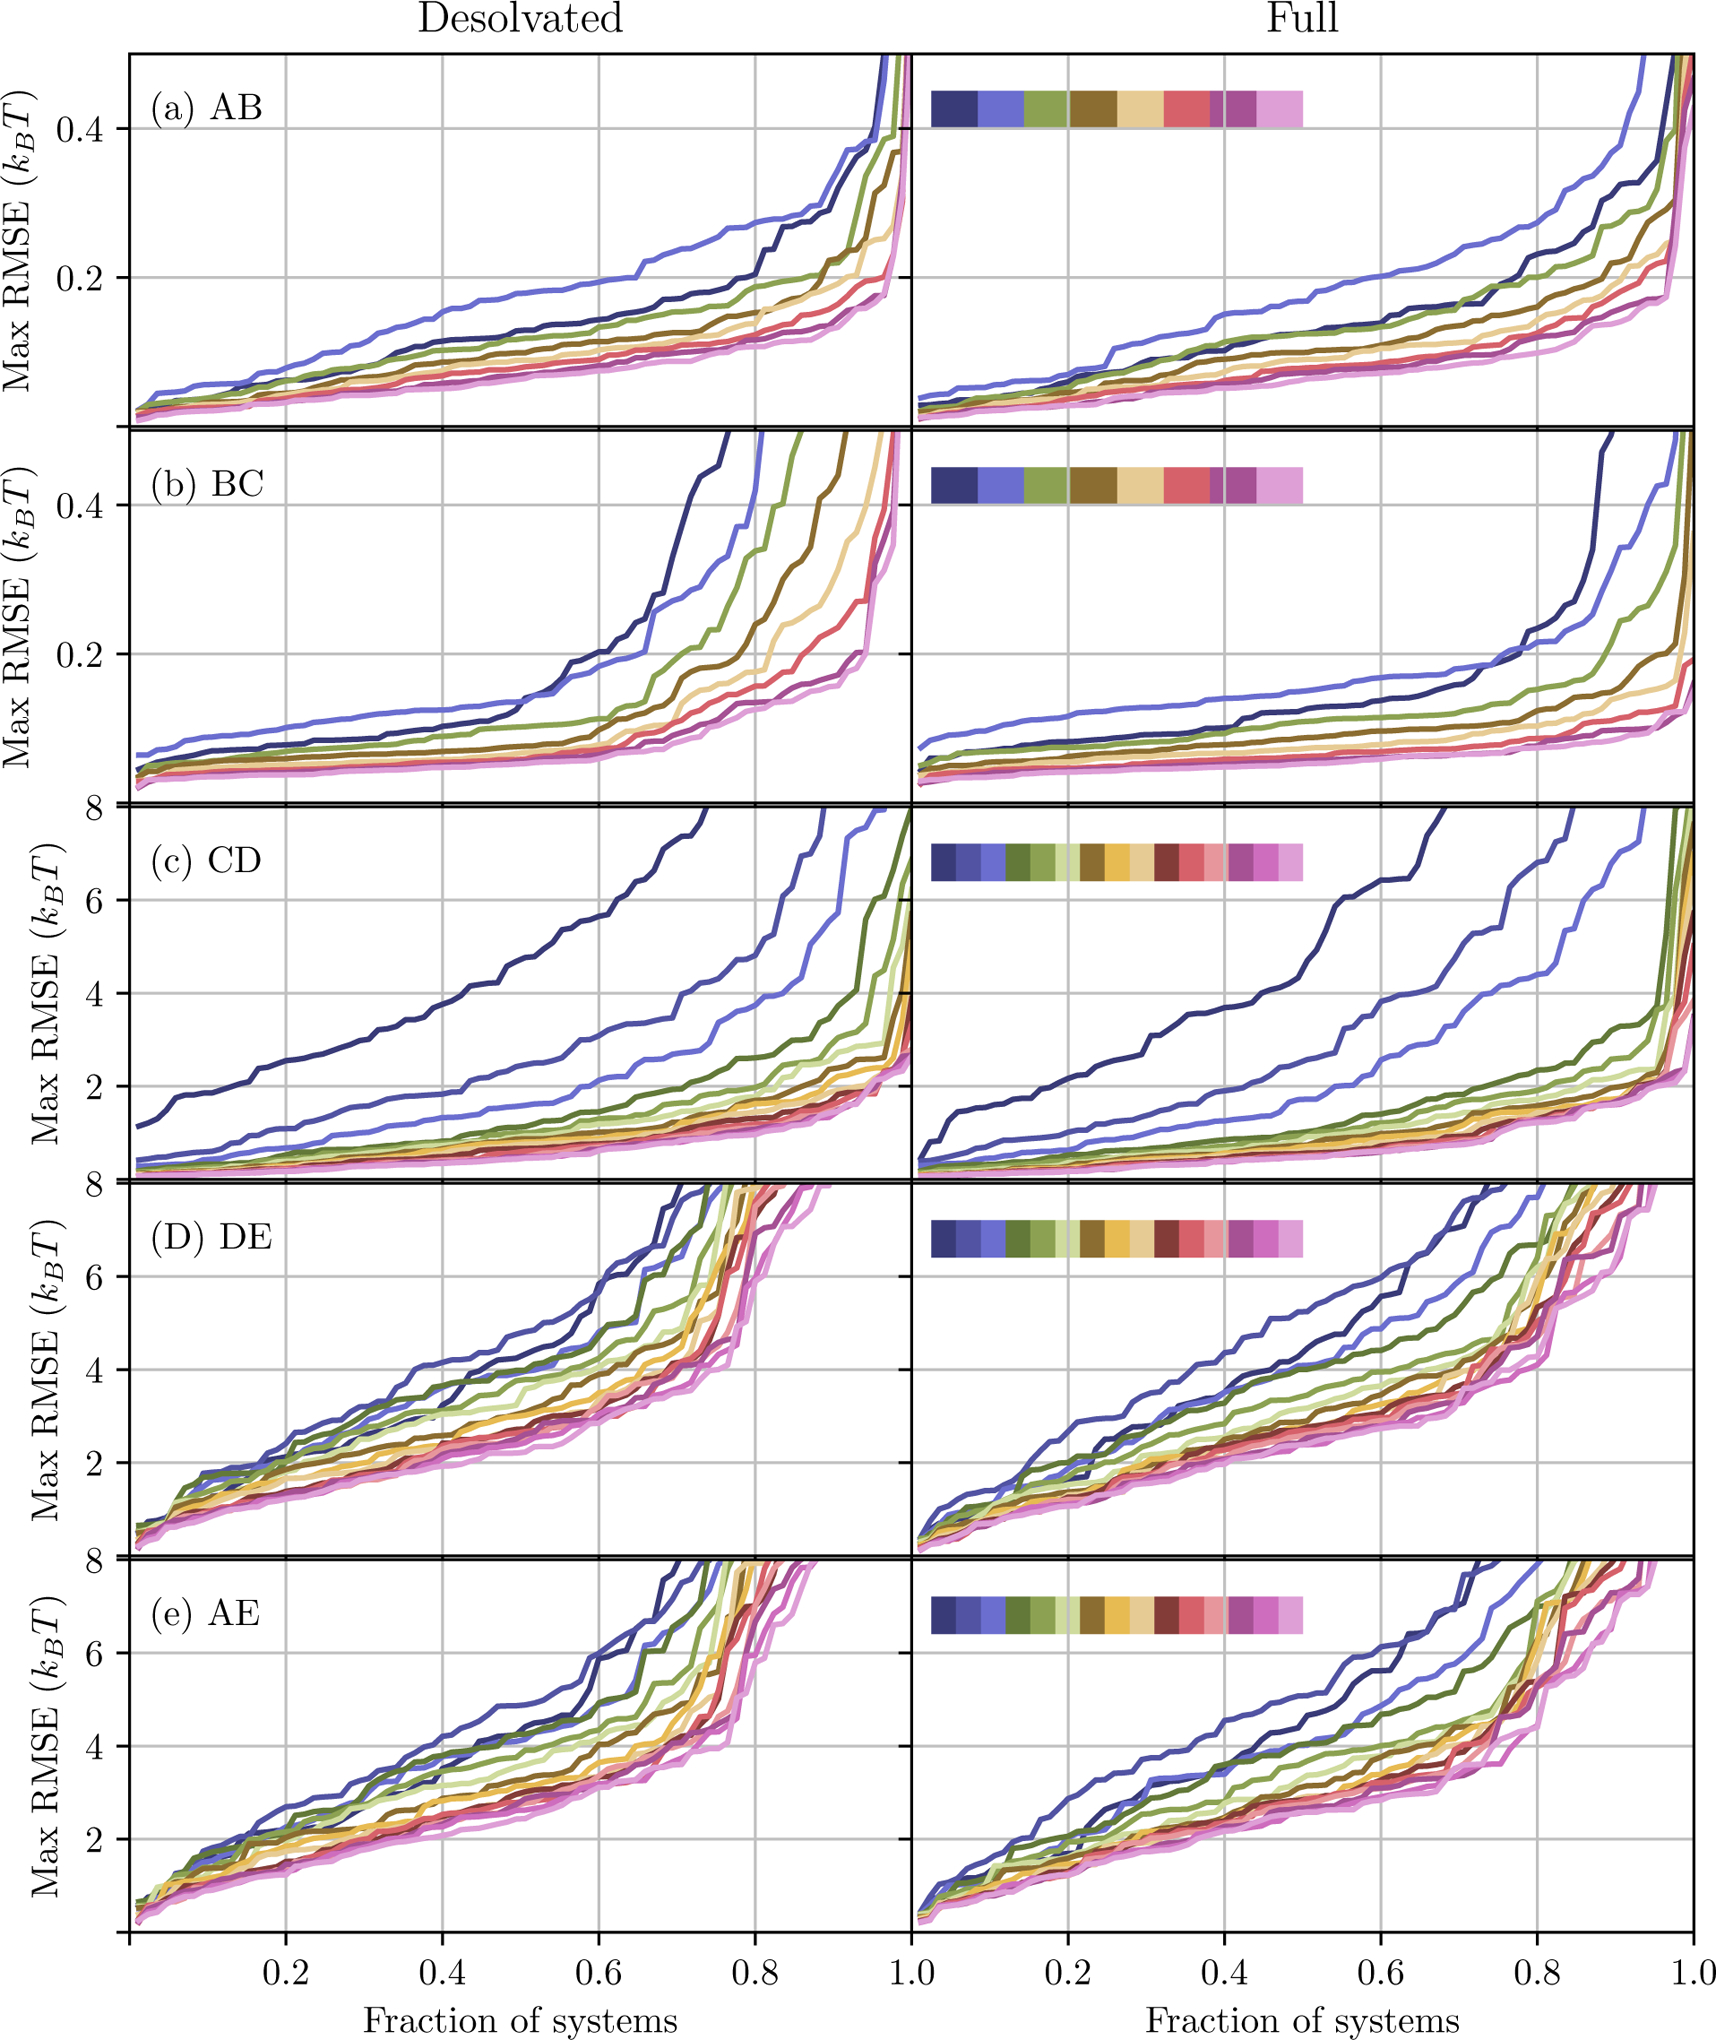
Figure 9:

Fraction of systems with free energy differences calculated within a certain root mean square error of the final value. The rows are for free energy differences between different pairs of milestones. The columns are for the Desolvated (left) and Full (right) solvation options. Each line indicates a different number of cycles, with a total of 8 for the top two rows and 15 for the remainder. In the sequence of colors inset in the right column of each row, the color indicate an increasing number of cycles from left to right.
