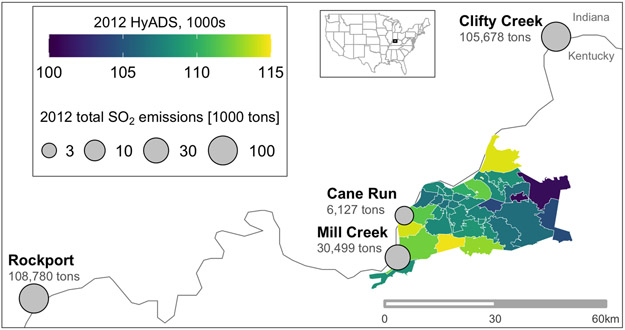
Figure 1:
Power plant locations, emissions, and exposure. The locations of the four coal-fired power plant facilities, total SO2 emissions (larger graduated grey circles indicate higher emissions), and HyADS exposures at the ZIP code level within Jefferson County, KY, USA in 2012. Unit and facility data downloaded from the U.S. Environmental Protection Agency Air Markets Program.50

