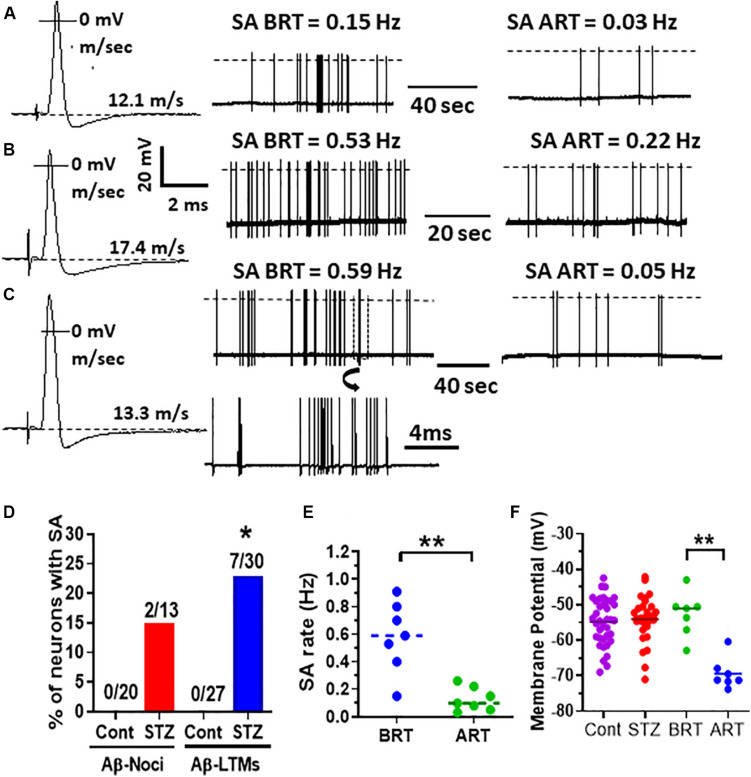
FIGURE 2.
Effects of retigabine on spontaneous activity (SA) and membrane potential (Em) in Aβ-LTMs in STZ rats. Shown in panels (A–C) are example records of three typical spontaneously active Aβ-LTMs recorded from STZ rats before and 15 min after systemic administration of retigabine (6 mg/kg, i.v.). The left traces (A,B and C,B) are somatic APs evoked by dorsal root electrical stimulation and recorded intracellularly from these three Aβ-LTMs; the CV (m/s) of each neuron is given above the Ems shown by dotted lines. The middle traces in panels (A–C) are original records of these neurons firing spontaneously at different rates before retigabine administration (BRT). The traces on the right in panels (A–C) illustrate that 15 min after retigabine (ART), the SA rate of these neurons was reduced from 0.15 to 0.03 Hz, 0.53 to 0.22 Hz, and 0.59 to 0.05 Hz, respectively. Shown below the middle trace in panel (C) is part of the trace shown in panel (C) (in a box) on an expanded time scale (note different time scales). Panel (D) shows that the percentage of Aβ-LTMs with SA (but not Aβ-nociceptors) is significantly greater (Fisher exact test, P < 0.05) than that of control Aβ-LTMs. Panel (E) shows that the median SA rate (0.59 Hz) for the whole sample of Aβ-LTMs tested (n = 7) was significantly (P < 0.01) reduced to 0.09 Hz 15 min after retigabine (ART) administration. Panel (F) shows that retigabine (6 mg/kg, i.v.) caused a highly significant decrease (hyperpolarization) in the median resting membrane potential (Em) of the Aβ-LTMs in STZ rats (P < 0.001, paired t-test). Note that there was no significant difference in the median Em between STZ and control Aβ-LTMs. The voltage and time scales to the right of AP shown in panel (B) are for all three evoked APs. The dotted lines on the traces indicate AP overshoot. *P < 0.05; **P < 0.01.

