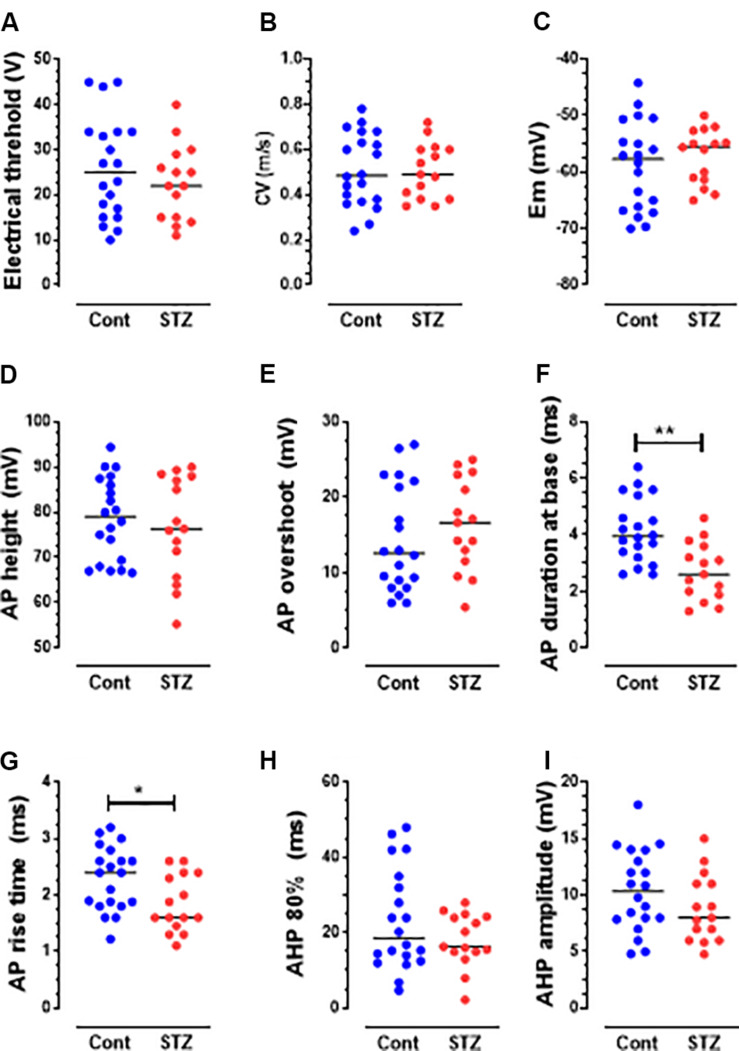
FIGURE 3.
Changes in AP variables in C-fiber mechano-sensitive nociceptors in STZ rats. The graphs (A–I) show scatterplots of variables measured 5 weeks post-STZ. These variables are: electrical threshold (A), CV (B), Em (C), AP height (D), AP overshoot (E), AP duration at base (F), Rise time (RT) (G), AHP duration (AHP 80%, H) and AHP amplitude (I). Each dot in these graphs and in those shown in Figure 4 represents a value from one neuron. Medians are superimposed. Note the significant decreases in the durations of AP (F) and RT (G), but not in other variables. Comparisons between medians in columns 1 (control, blue dots) and column 2 (STZ, red dots) were with the Mann–Whitney U test. The level of statistical significance is as follows: ∗P < 0.05; ∗∗P < 0.01.

