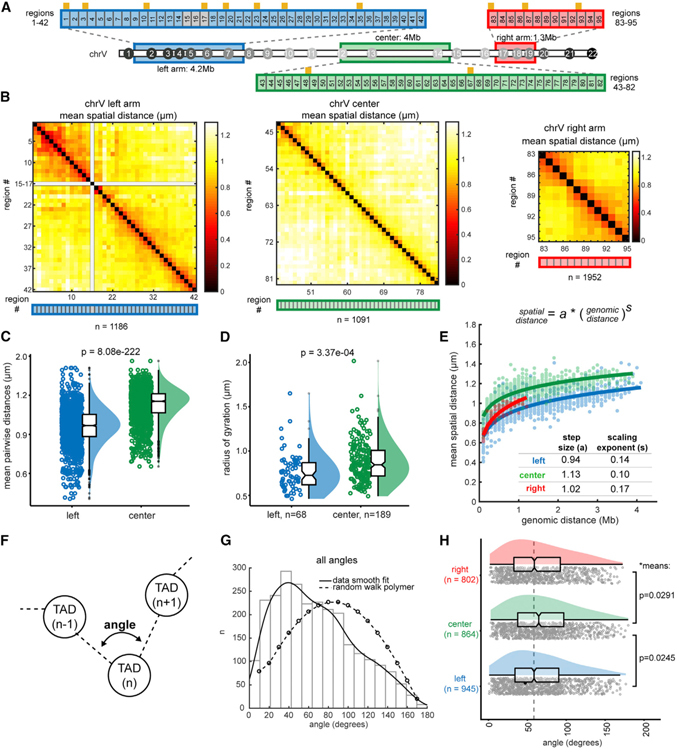
Figure 3. Early Embryonic Chromosomes Adopt a Barbell-like Organization.
(A) Schematic of high-resolution tracing regions (consecutive 100-kb regions) of the left arm, center, and right arm. Regions 15–18 contain repetitive sequences and were not uniquely probe-able. TAD boundaries are represented by orange ticks.
(B) Mean distance matrices between regions in the left arm, center, and right arm. (C and D) Comparison of the center and left arm in overall mean pairwise distances (C) and radii of gyration.
(D) Data are presented by raincloud plot: individual points, the distribution curve, and boxplots representing the median, boxed by the 25th to 75th percentiles. Whiskers extend to the highest and lowest data points, not including outliers (gray circles). Significance calculated by one-way ANOVA.
(E) Power-law scaling of spatial distance to genomic distance for the left arm, right arm, and center. s (scaling exponent) and a (step size) are derived from the best fit curve (solid lines). The 95% confidence intervals of the fits are as follows: left a (0.937, 0.946), left s (0.138, 0.149), center a (1.121, 1.128), center s (0.101, 0.108), right a (1.00, 1.033), and right s (0.159, 0.185).
(F) Schematic of angle measurements between consecutive TADs (i.e., at the vertex of TAD (n — 1)-TAD(n)-TAD(n + 1)) in all individual traces.
(G) Histogram of the angles generated between all consecutive TADs. The data are fit to a kernel distribution (solid line), contrasted with the expected values for a random walk polymer (dashed line).
(H) The angles data in (G) split by section: the left arm, center, and right arm. The means of the arms are significantly smaller than the center by two-sample t test without assuming equal variances.

