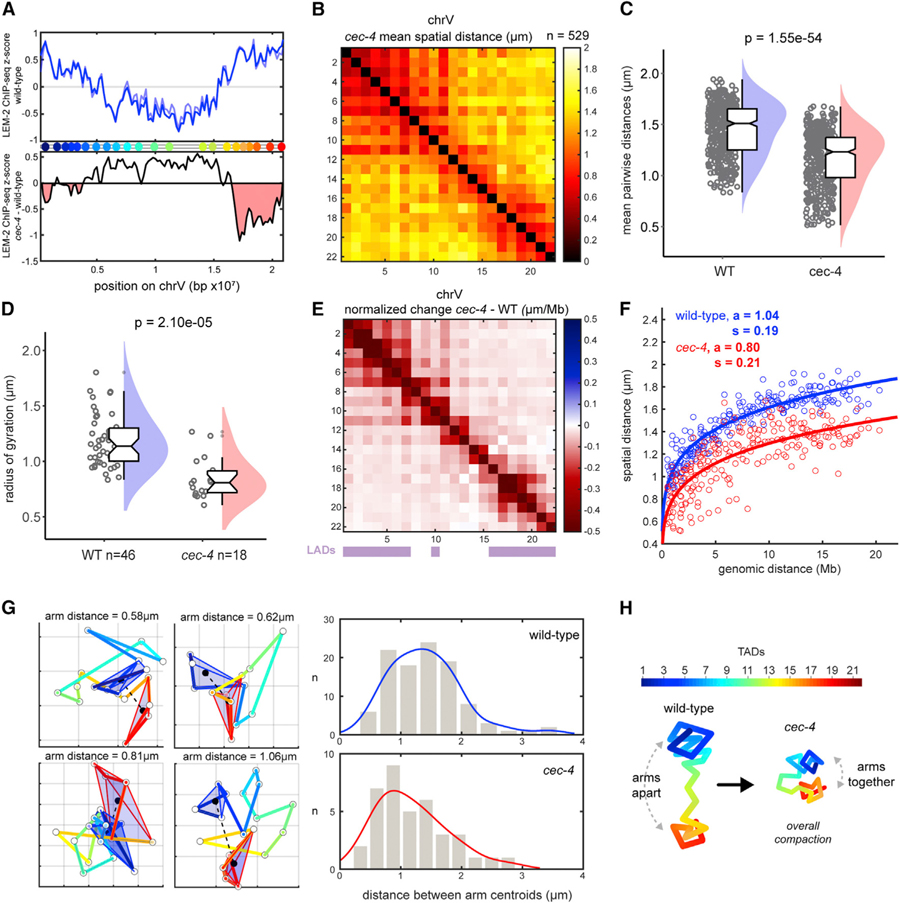
Figure 4. CEC-4 Stretches Chromosomes and overrides B-Compartment Self-Association.
(A) ChIP-seq signal for LEM-2 (lamina association) across chrV, plotted as Z score of ChIP-input for two replicates (blue lines) (top). Z score difference (cec-4 — wild-type [WT]) of LEM-2 ChIP (average of two replicates) (bottom). Regions in red indicate loss of lamina association in the mutant. Data are from Gonzalez-Sandoval et al. (2015).
(B) Mean distance matrix between TADs in cec-4 mutants. (C) Mean distances between TADs in WT and cec-4. (D) Radii of gyration in WT and cec-4 traces. Data are presented by raincloud plot as in Figure 3. Significance was calculated by one-way ANOVA.
(E) TAD-specific changes in normalized mean distance from WT to cec-4 embryos. WT LADs are displayed by purple bars.
(F) Scaling of mean distance versus genomic distance for WT (blue) and cec-4 (red). The 95% confidence intervals are as follows: WT a (1.024, 1.055), WT s (0.179, 0.194), cec-4 a (0.767, 0.824), and cec-4 s (0.196, 0.228).
(G) Example cec-4 chromosome traces in xy projection (grid size = 500 nm). TADs of the left (blue) and right (red) arms were enclosed in 3D Delaunay tri-angulations to visualize their volumes. The distances between arm centroids were measured and plotted with kernel distribution fits (right), indicating chrV arms are closer in cec-4.
(H) Schematic representation of chrV conformations in WT and cec-4 mutants.
See also Figure S4.

