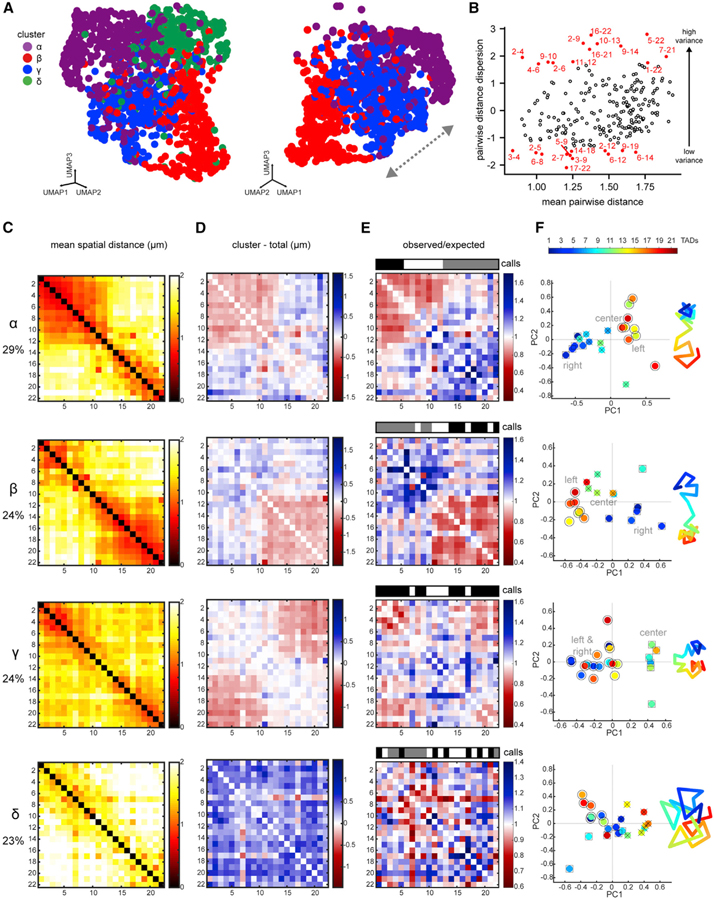
Figure 5. Single Chromosomes Fold into Multiple Higher-Order Conformations.
(A) UMAP plot of chrV clusters, where each dot represents a single trace (left). UMAP of clusters α-γ-β, showing a possible transition (right). Colors represent clusters defined in 20D space.
(B) Dispersion of TAD pairs versus mean distance (see STAR Methods). TAD pairs with lowest variance have low dispersion, and pairs with high variance have high dispersion (top and bottom 5% in red).
(C) Distance matrices of each cluster in (A).
(D) Difference matrices between each cluster and the population average (red, compaction; blue, separation).
(E) Normalized distance matrices for each cluster as observed/expected values. Compartment calls are presented as in Figure 2. Only cluster γ displays conventional compartmentalization.
(F) Each TAD from the cluster distance matrices plotted in 2D principal-component space. TADs of the same compartment are labeled by shape (○,□, x). A simplified cartoon for each cluster is shown to the right, colored by TAD.
See also Figures S5 and S6.

