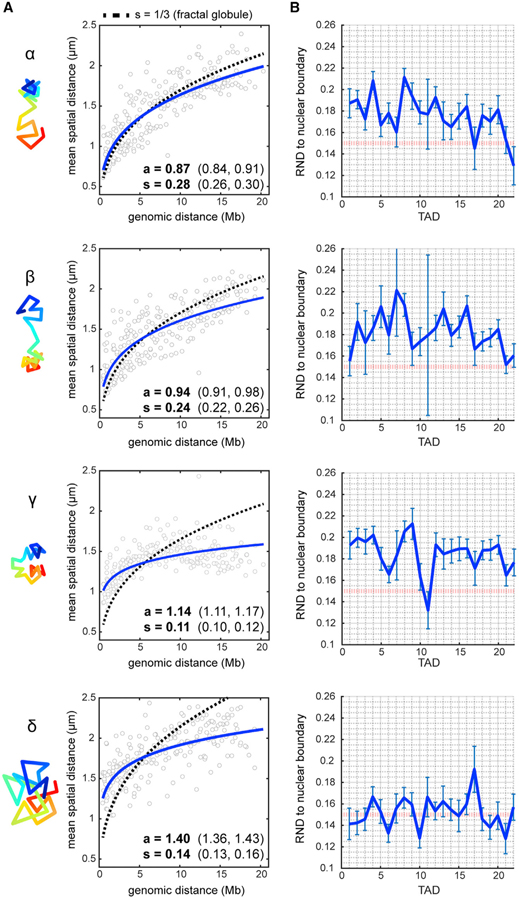
Figure 6. Single-Chromosome Analysis Reveals Subpopulations with Unique Folding Patterns.
(A) Power-law scaling of spatial distance to genomic distance for each cluster (blue, best fit curves of the raw data). s = scaling exponent of spatial distance, a = step size. Values in brackets are 95% confidence intervals of the fit. Dotted line represents the fractal globule model prediction with s = 1/3.
(B) Radial-normalized mean distance (RND) to nuclear boundary for each TAD in individual traces (see STAR Methods). Red dotted line indicates RND = 0.15 (lamina contact). Error bars represent ±SEM.

