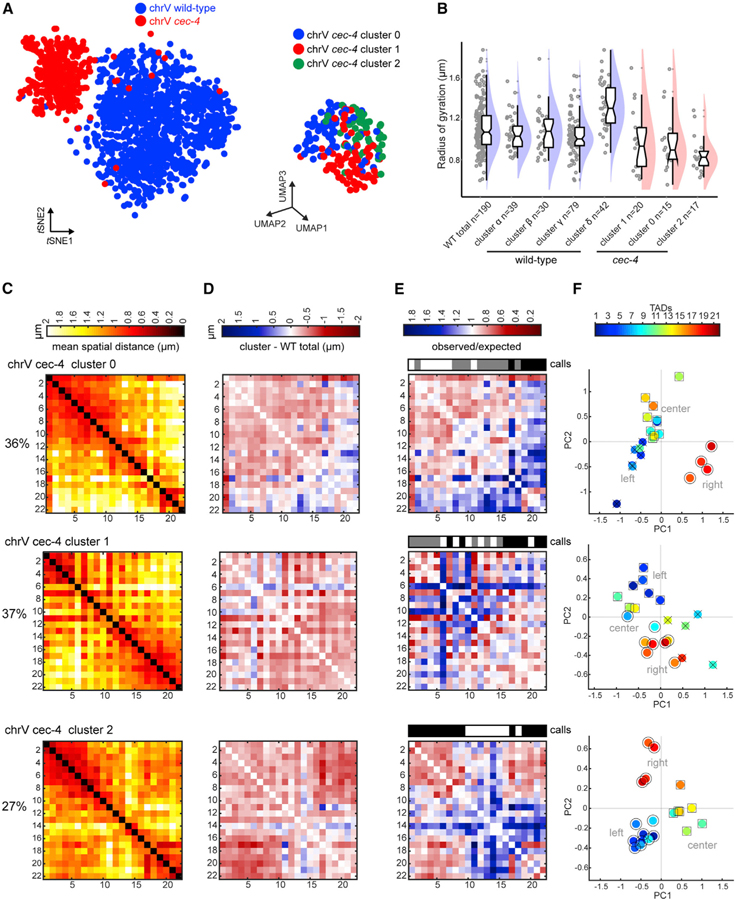
Figure 7. Lamina Association Is Required for Open Morphology.
(A) t-SNE plot comparing chrV WT (blue) and cec-4 (red) traces (left). UMAP plot of chrV cec-4 clusters (right).
(B) Radii of gyration of WT chromosome clusters (as in Figure S5C for direct comparison) and cec-4 clusters, indicating subpopulations of cec-4 chromosomes are consistently more compact than WT. Data presented by raincloud plot, as in Figure 3.
(C) Distance matrices of cec-4 clusters 0–2.
(D) Difference matrices between each cec-4 cluster and the WT population average (red, compaction; blue, separation).
(E) Normalized distance matrices for each cluster as observed/expected values. Compartment calls are presented as in Figure 2. Only cluster 2 displays conventional compartmentalization.
(F) Each TAD from the cluster distance matrices plotted in 2D principal-component space. TADs of the same compartment are labeled by shape (○,□, x).
See also Figure S7.

