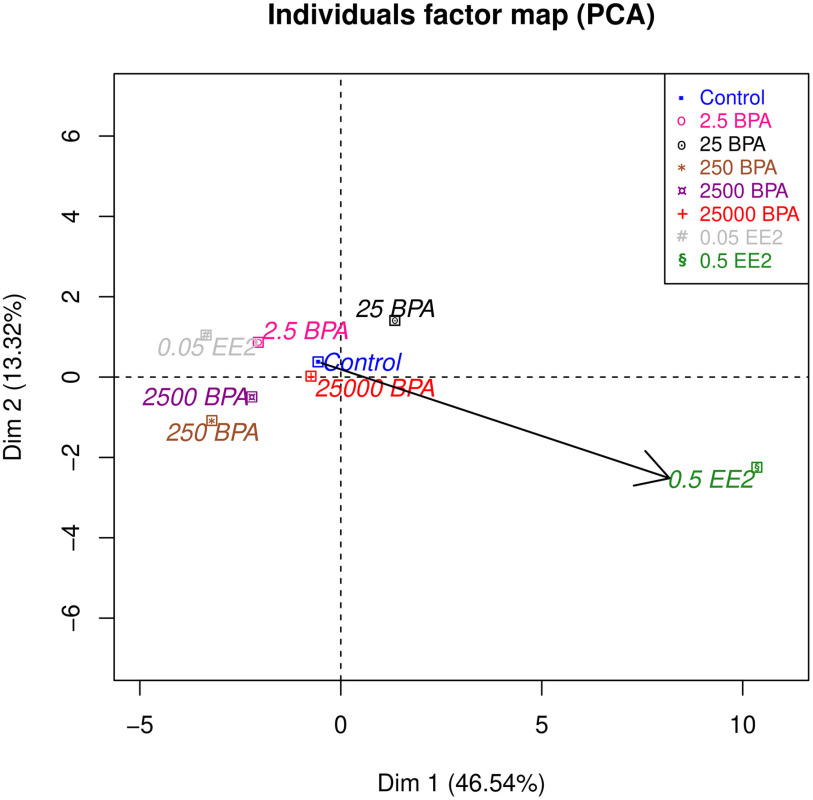
Figure 11.
Comparison between semiquantitative scoring and the principal components from morphological analysis in PND21C animals. Units: body weight (BW) per day. The arrow represents the semiquantitative scoring analyzed by PCA as a supplementary quantitative variable and corresponds clearly to the direction from control to 0.5EE2. The arrow’s direction does not capture the contrast between 25BPA and 250BPA, which is almost orthogonal. Number of animals per group . Note: BPA, bisphenol A; Control, vehicle control; EE2, ethinyl estradiol; PCA, principal component analysis; PND, postnatal day.

