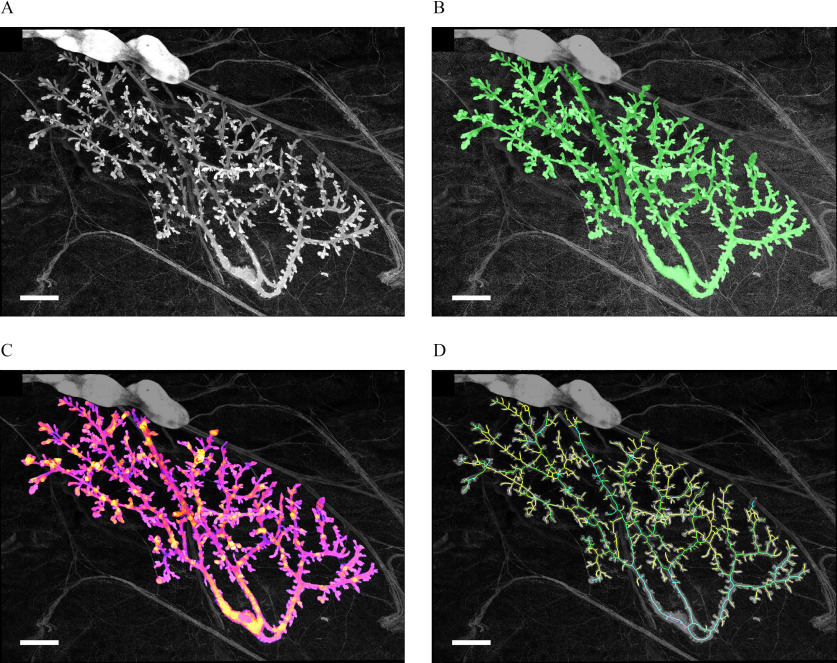
Figure 2.
PND21 mammary gland from chronic study at different steps of analysis. All images are projections and all data are processed as 3D stacks. (A) Original image after stitching. (B) Green overlay of the epithelium after segmentation (identification of the epithelium). (C) Analysis of the local thickness of the epithelium, warmer colors correspond to thicker parts of the epithelium in 3D. (D) Estimated skeleton of the epithelial tree, the color of a branch corresponds to the depth of the tree that starts at this branch. Scale bars: . Note: PND, postnatal day; 3D, three-dimensional.

