. 2020 May 20;128(5):057001. doi: 10.1289/EHP6301

Figure 5.

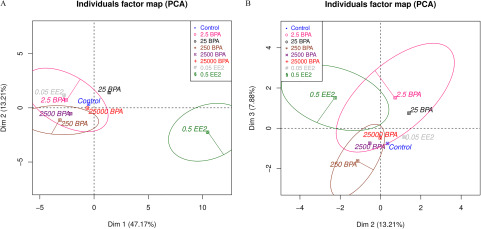
Figures 5A and 5B are graphs, each titled Individuals factor map (PCA) plotting Dim 2 (13.21 percent) ranging from negative 5 to 5 in increments of 5 and Dim 3 (7.88 percent) ranging from negative 2 to 4 in increments of 2 (y-axis) across Dim 1 (47.17 percent) ranging from negative 5 to 10 in increments of 5 and Dim 2 (13.21 percent) ranging from negative 4 to 4 in increments of 2 (x-axis), respectively, for Control, 2.5 BPA, 25 BPA, 250 BPA, 2500BPA, 25000 BPA, 0.05 EE2, and 0.5 EE2.

Principal component analysis (PCA) of data obtained by the quantitative analysis of PND21C animals. Units: μg/kg body weight (BW) per day. In all cases, we represent only the mean of each exposure group. (A) Dim 1 (correlated to the size) and Dim 2 (local thickness). (B) Dim 2 (local thickness) and Dim 3 (ductal length) Ellipses show some confidence intervals, and the variability of the data remains high. Number of animals per group n=810. Note: BPA, bisphenol A; Control, vehicle control; Dim, dimension; EE2, ethinyl estradiol.